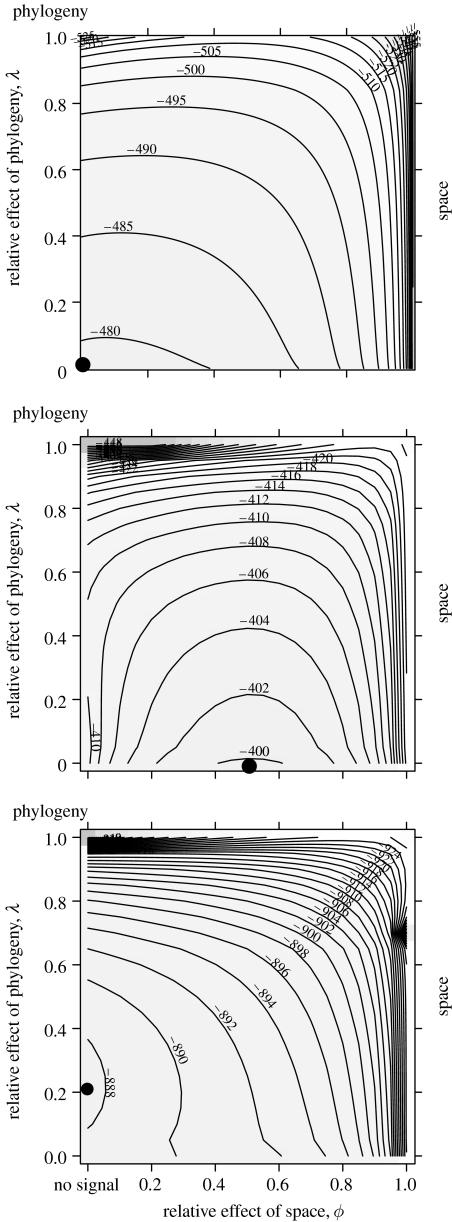
Figure 4.
Contour plots for joint likelihoods of ϕ and λ for the data on range sizes in three orders of mammals ((a) carnivores, (b) artiodactyls and (c) primates). The contours show parameter combinations of equal likelihood and the filled circles indicate the joint maximum-likelihood values (see table 2 for details).

