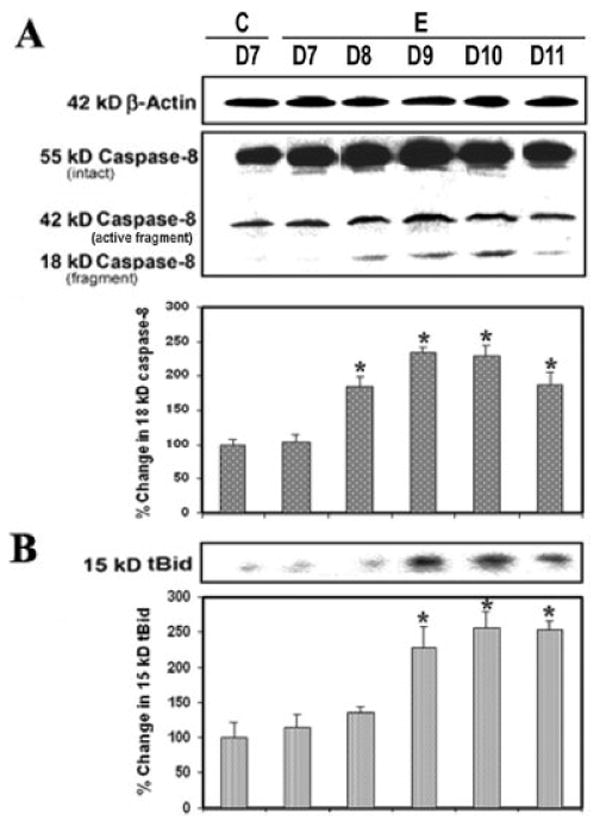
Fig. 4.

Caspase-8 activity during EAE. Time-dependent changes in 42-kDa and 18-kDa caspase-8 (A) and 15-kDa tBid (B) expression during acute EAE. Upper panels (A–D) show representative Western blots, and lower panels show the corresponding bar graphs (n ≥ 3 animals per group). β-Actin was used as a control for equal protein loading. Data are presented as percent increase compared with the control set at 100% (C, control; E, EAE;. D7–D11, day 7 to day 11).
