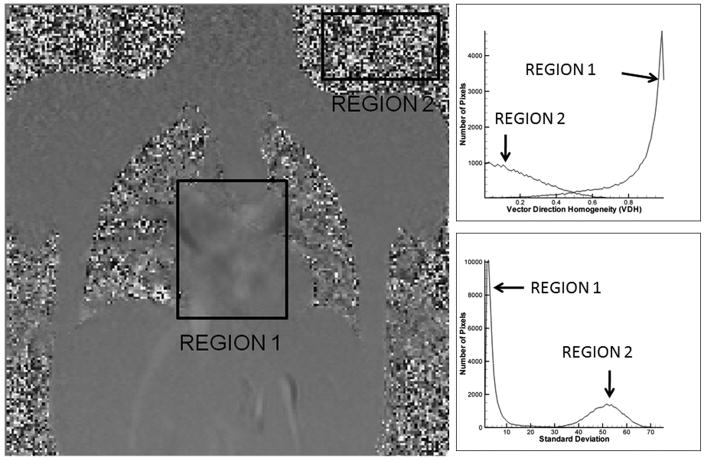
Figure 4.
The properties of noise and flow in different regions of the PC MR image. The top right graph shows the histogram distribution of the vector direction homogeneity and the bottom right graph shows the histogram distribution of the standard deviation of the velocity field. Region1 is Flow and Region 2 is Noise

