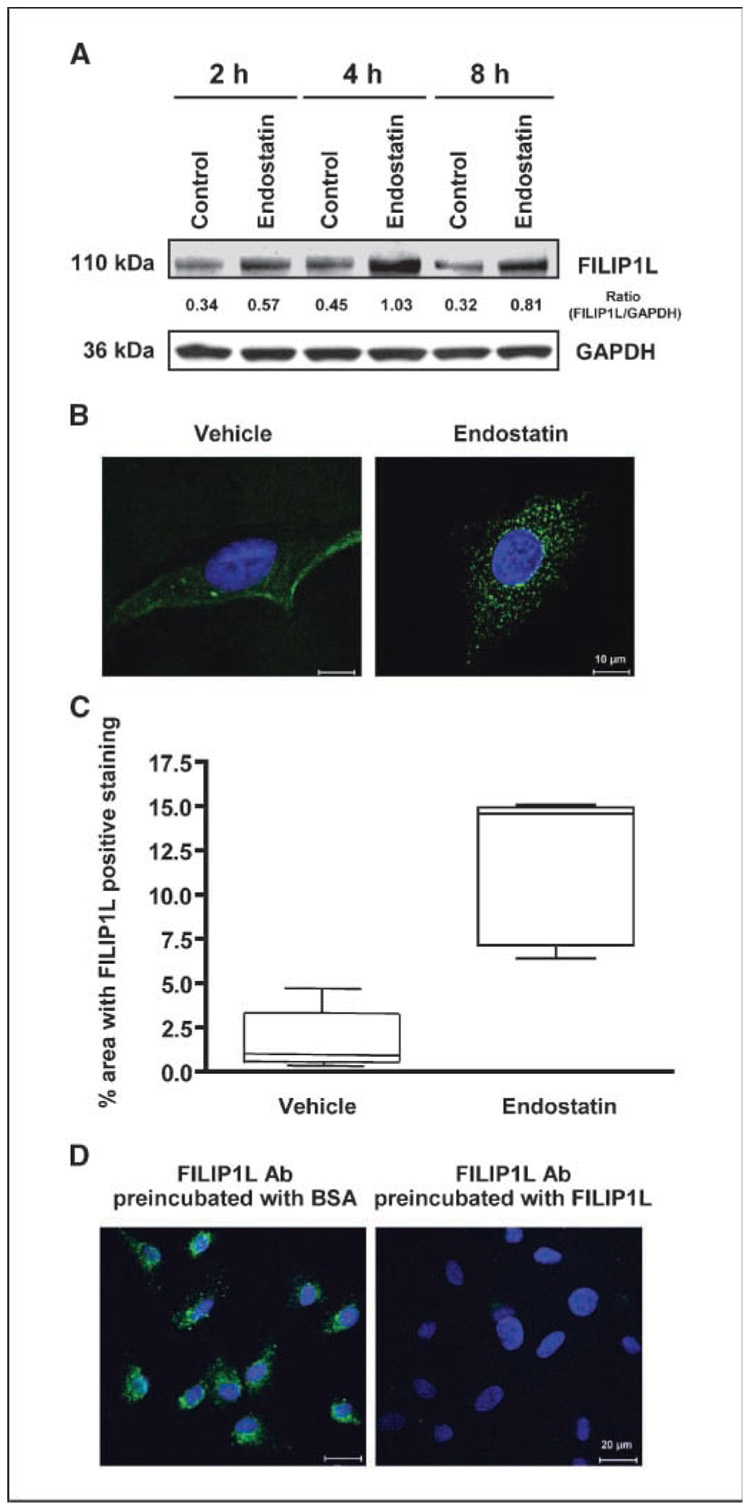
Figure 2.
Up-regulation of FILIP1L protein by endostatin. A, increased expression of FILIP1L protein was detected in HUVECs treated with endostatin for 2, 4, and 8 h by Western blot using anti-FILIP1L antibody. GAPDH blot is shown as the loading control. The numbers underneath the blot are the densitometric values calculated as FILIP1L-GAPDH ratios using ImageQuant software. The result is representative of two independent experiments. B, the punctate distribution in the cytoplasm was detected in HUVECs treated with endostatin for 4 h by immunofluorescent staining using anti-FILIP1L antibody. Vehicle-treated control cells showed diffused cytoplasmic staining. Nuclear staining with DAPI is shown in blue. Scale bar, 10 µm. The result is a representative image from two independent experiments. Additional images are shown in Supplementary Fig. S1. C, FILIP1L expression in endostatin-treated HUVECs was significantly more than that in vehicle-treated control cells (P = 0.0012). Five images from each treatment group (B) were analyzed. Axiovision 4.6 software (Zeiss) was used to quantify the percentage area with FILIP1L-positive staining. Box and whiskers plot (GraphPad Prism 3.0) is shown. D, preincubation of anti-FILIP1L antibody with FILIP1L protein, but not with BSA, abrogated the punctuate staining seen in HUVECs treated with endostatin. Nuclear staining with DAPI is shown in blue. Scale bar, 20 µm.

