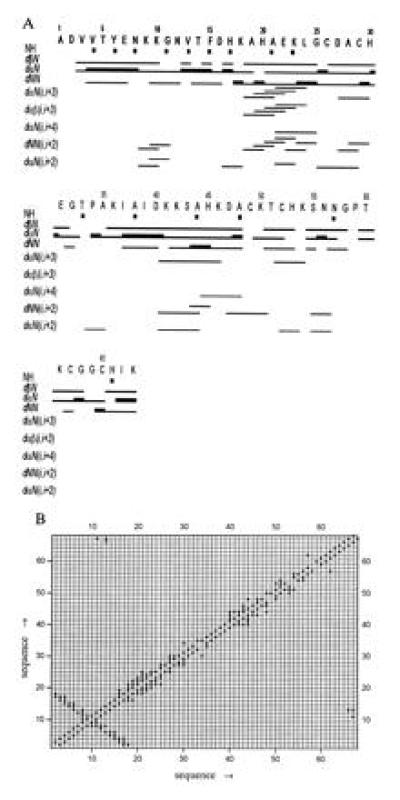
Figure 4.

(A) Schematic representation of the sequential connectivities involving NH, Hα, and Hβ protons. The thickness of the bar indicates the NOEs intensities. In the first line, NH resonances that have been found to exchange slowly in D2O solution are also indicated. (B) Diagonal plot of the NOEs observed between the backbone protons, which identify the secondary structure elements.
