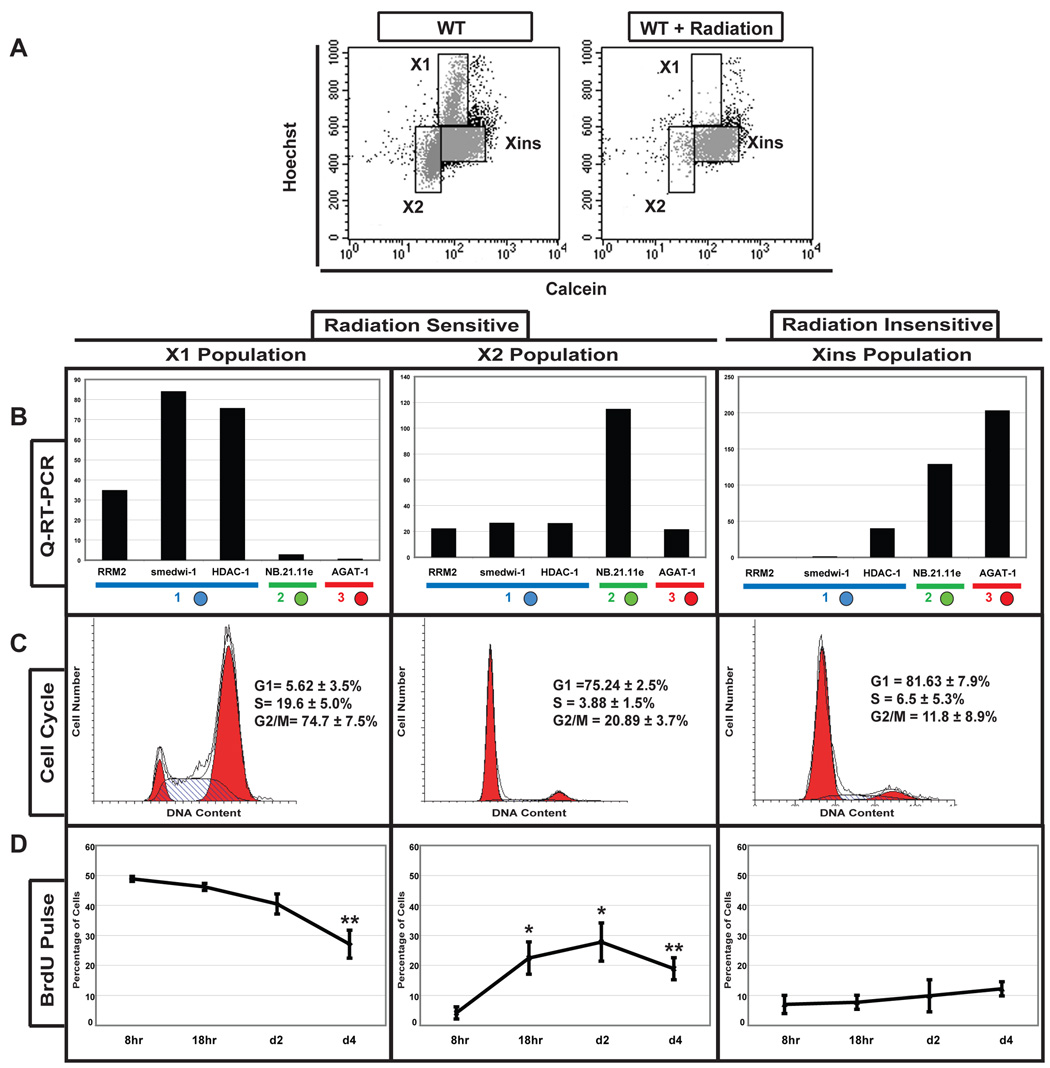
Figure 3. Molecular Analyses of FACS-purified irradiation-sensitive cells.
(A) Wild type (WT) and irradiated planarian (+D7) flow cytometry (Hoechst/Calcein). Populations X1 and X2 disappear after irradiation. Xins designates the irradiation insensitive population. (B) Quantitative RT-PCR of X1, X2 and Xins cells. Blue, green, and red circles represent Category 1, 2, and 3 genes, respectively. Gene expression levels are relative to the ubiquitously expressed GAPDH. (C) Flow cytometric cell cycle profile of sorted X1, X2 and Xins populations stained with propidium iodide. Percentages of cells within each phase of the cell cycle are shown (n=6). (D) BrdU incorporation into X1, X2 and Xins populations at defined times after BrdU administration by feeding. Error bars are SEM. Student’s t-test was used for statistical comparisons to 8hr time point (*p<0.03, **p<0.01).

