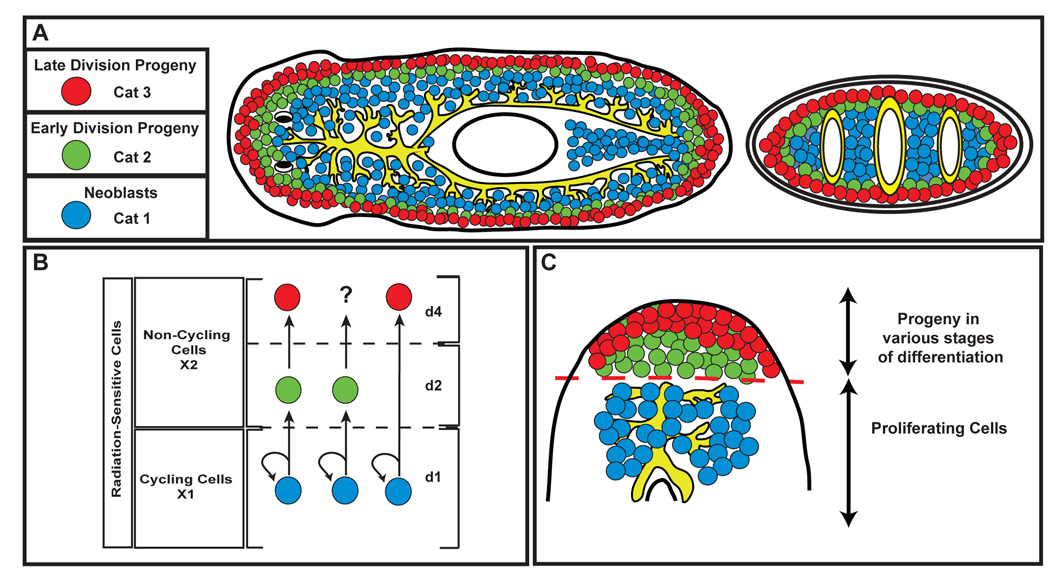
Figure 6. Planarian ASCs and their descendents.
(A) Distribution of expression patterns observed for Category 1, 2, and 3 genes. Representative genes for each category are listed. (B) Lineage determination in planarian ASCs. Three different scenarios for changes in gene expression during migration are depicted. (C) Population dynamics of ASCs and descendents during regeneration. Proliferating ASCs are restricted to the area below the amputation plane, and give rise to descendents which migrate into the blastema tissue and differentiate into the appropriate cell types. Dashed red line: amputation plane.

