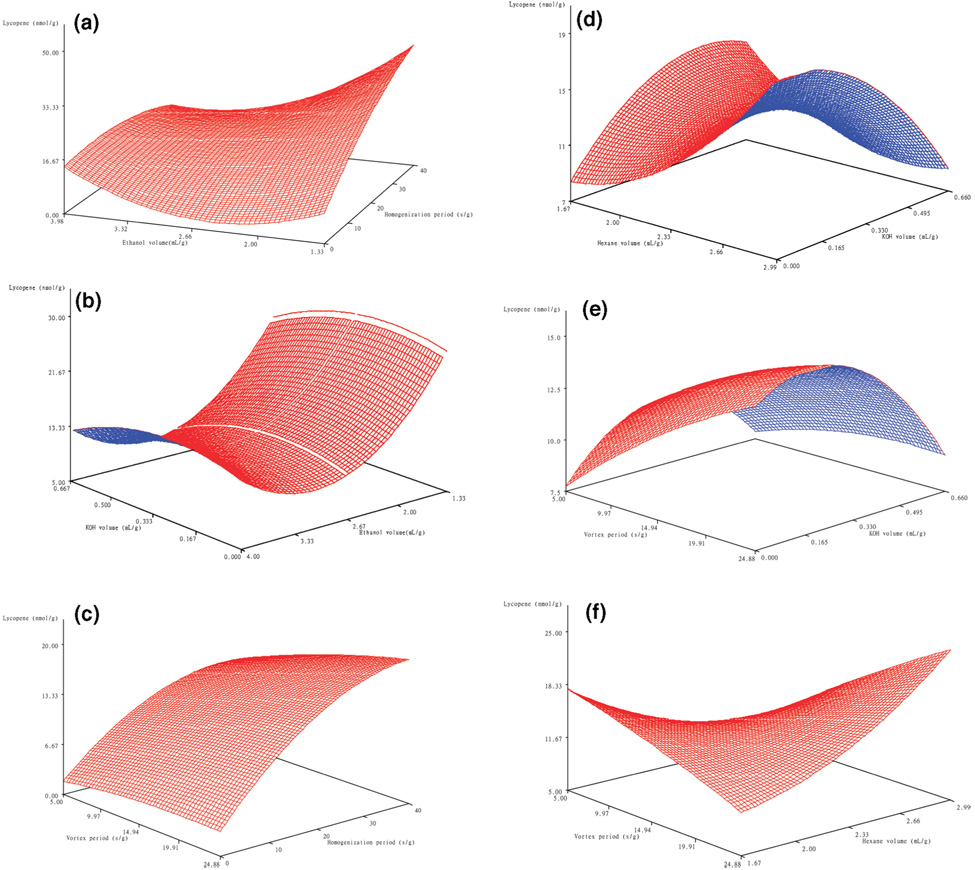
Figure 1. Response surface plots showing the effects of variables in the yield of lycopene (nmol/g tomato cells, y-axis).
(a) Ethanol volume (x-axis) and homogenization period (z-axis); (b) KOH volume (x-axis) and ethanol volume (z-axis); (c) Vortex period (x-axis) and homogenization period (z-axis); (d) Hexane volume (x-axis) and KOH volume (z-axis); (e) Vortex period (x-axis) and KOH volume (z-axis); (f) Vortex period (x-axis) and hexane volume (z-axis).

