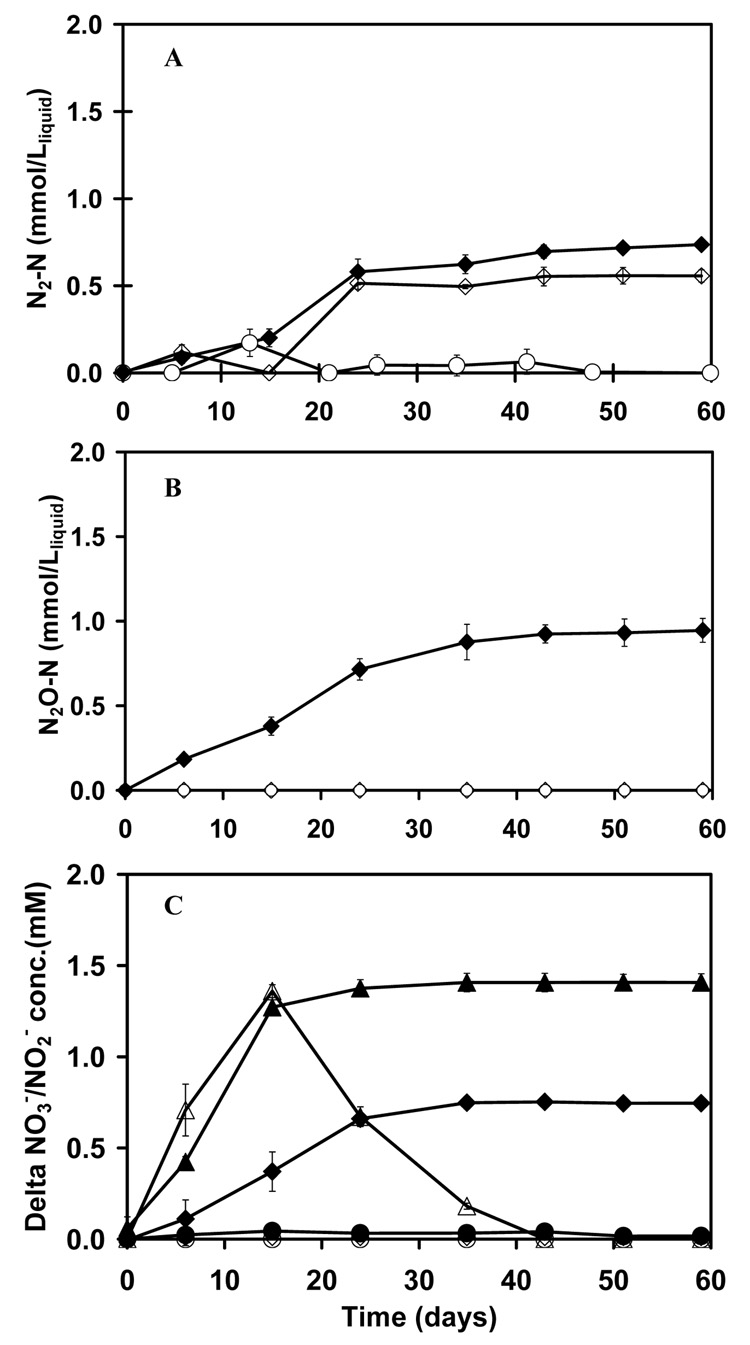
Figure 4.
Denitrification at a high initial As(III) aqueous concentratio (3.5 mM). The formation of N2 (panel A) and N2O (panel B) by NGS. Legend for panels A and B: full treatment with As(III) and NO3− (◆); endogenous control with only NO3− added (◇); and the abiotic control with As(III) and NO3− (○). Panel C shows the consumption of NO3− and the temporal accumulation of NO2−. Legend for panel C: NO3− consumption in the full treatment with As(III) and NO3− (▲); NO3− consumption in the endogenous substrate control with only NO3− added (◆); NO3− consumption in the abiotic control with As(III) and NO3− (●); NO2− accumulation in the full treatment with As(III) and NO3− (△); NO2− accumulation in the endogenous substrate control with only NO3− added (◇); NO2− accumulation in the abiotic control with As(III) and NO3− (○).

