
Figure 2. Survival and kidney injury of FA-CLP model.
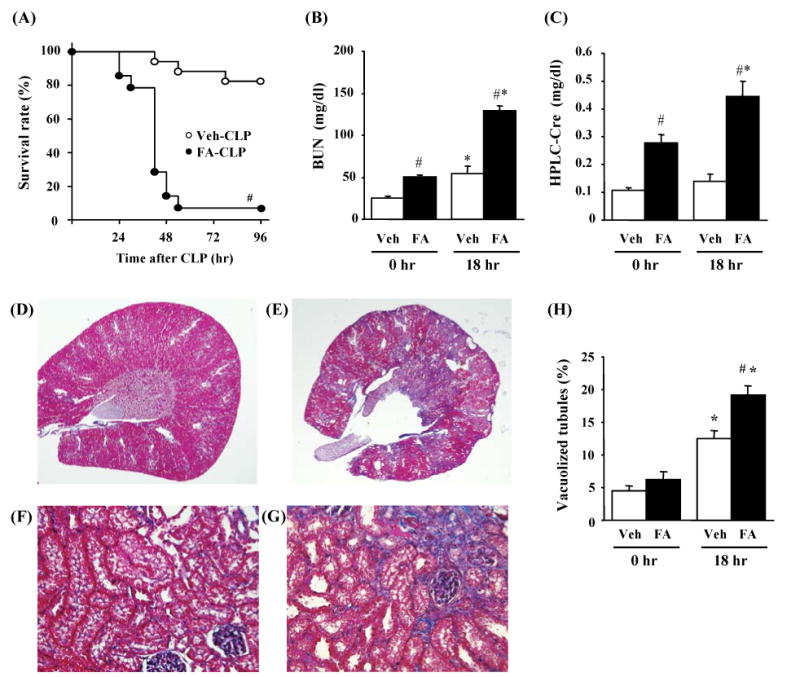
(A) Survival analysis of FA-CLP (n = 14) and Veh-CLP (n = 17). (B-C) Renal function of Veh-CLP and FA-CLP mice. BUN and serum Cr were measured 0 and 18 hr after CLP (n = 14 in FA-CLP, n = 17 in Veh-CLP). (D-G) Representive renal histology of Veh-CLP (D, F) and FA-CLP (E, G) at 18 hr are shown with Masson trichrome staining. Original magnification: X20 in (D, E) and X400 in (F, G). (H) Percentage of vacuolized tubules (n = 3 at 0hr, n = 5 at 18 hr per group). #, P < 0.05 versus Veh-CLP. *, P < 0.05 versus CLP 0 hr.