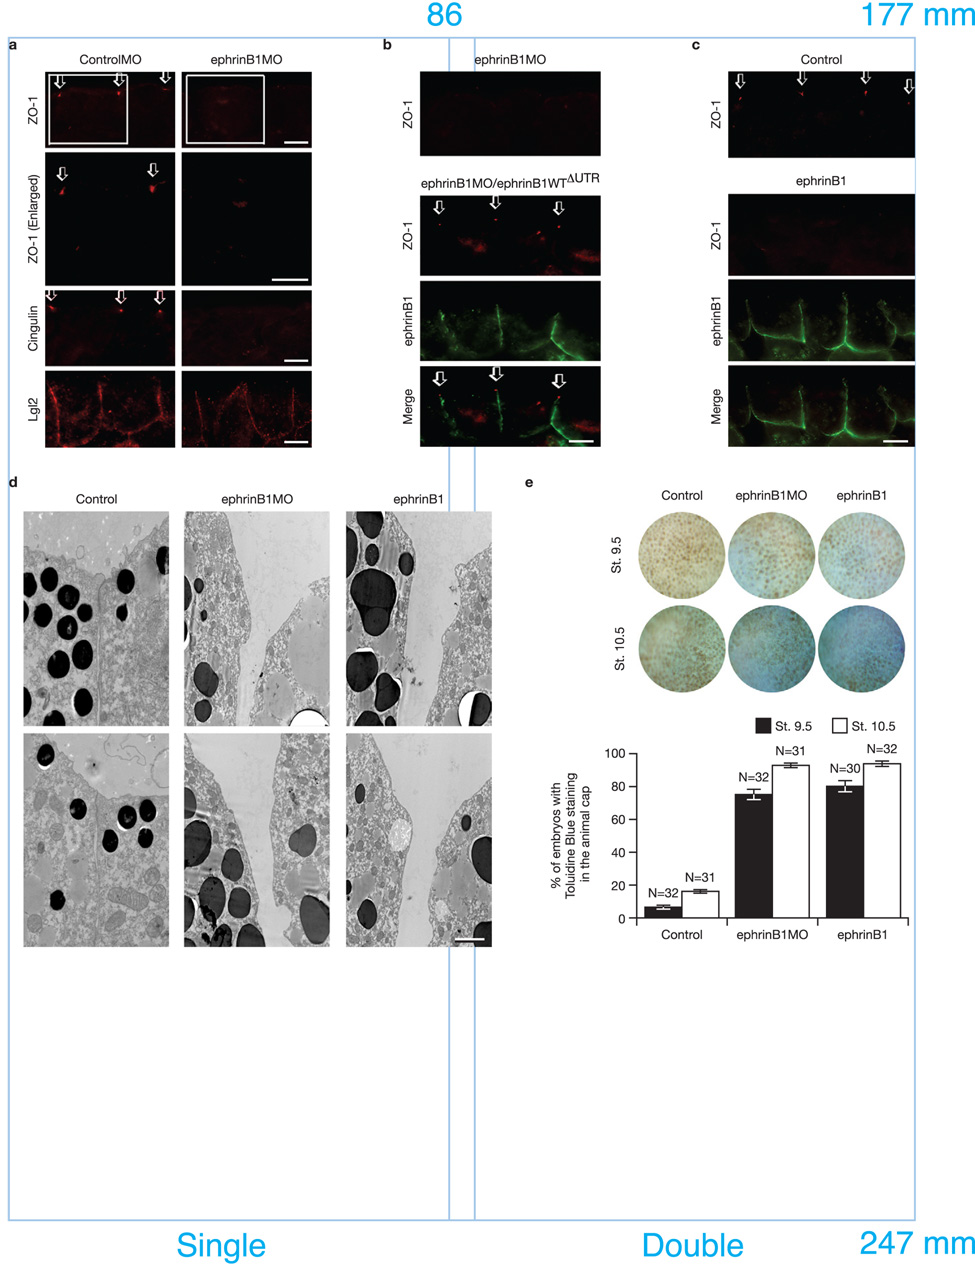
Figure 2. Inhibition and over-expression of ephrinB1 causes the disruption of TJ formation.
(a) Each blastomere of 2-cell stage embryos was injected with 20 ng of ephrinB1MO or ControlMO where indicated. Embryos were sectioned and immunostained for ZO-1, Cingulin, and Lgl2. Boxed regions of first panel are enlarged in second panel. Arrows indicate the ZO-1 and Cingulin localization in TJs. The scale bar corresponds to 1 µm. (b) Each blastomere of 2-cell stage embryos was injected with 20 ng of ephrinB1MO and 150 pg of ephrinB1WTΔUTR-HA RNA where indicated. ΔUTR indicates use of a mutant RNA lacking a 5’ UTR sequence which is complementary to the ephrinB1MO, conferring resistance to the ephrinB1MO. Embryos were sectioned and immunostained for ZO-1 and ephrinB1 (HA). Arrows indicate the ZO-1 localization in TJs. The scale bar corresponds to 1 µm. (c) Each blastomere of 2-cell stage embryos was injected with 200 pg of ephrinB1-HA RNA. Embryos were sectioned and immunostained for ZO-1 and ephrinB1 (HA). Arrows indicate the ZO-1 localization in TJs. The scale bar corresponds to 1 µm. (d) Each blastomere of 2-cell stage embryos was injected with 20 ng of ephrinB1MO or 150 pg of ephrinB1-HA RNA and collected at Stage 10.5. Transmission electron microscopy shows disruption of TJs when ephrinB1 is inhibited or over-expressed in embryos. The scale bar corresponds to 0.5 µm. (e) Each blastomere of 2-cell stage embryos was injected with 20 ng of ephrinB1MO or 150 pg of ephrinB1-HA RNA. Embryos were collected at stage 9.5 and 10.5 and stained with 0.01% toluidine blue. At each stage, positive stained embryos were counted from each group and presented as a percentage (see histogram). Embryos were scored as positive when over 10% (St. 9.5) or over 50% (St. 10.5) of the ectodermal surface was stained. Note: More toluidine blue dye permeated the animal pole ectodermal layer of MO-injected (75.0±3.13% − 90.4±0.74% sem of embryos) and ephrinB1 over-expressing embryos (80.0±1.19% − 93.8±1.56% sem of embryos) than control (6.3±1.56% − 16.3±0.95% sem of embryos).

