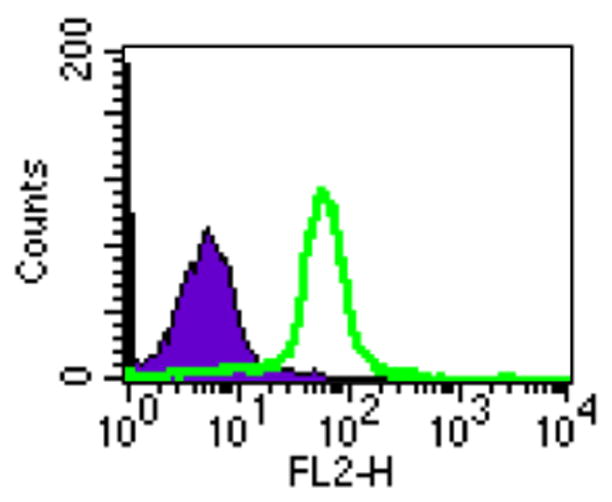
Figure 1. Flow cytometry analysis to demonstrate the expression of DR5 on TC-1 tumor cells.

TC-1 cells were isolated and stained with PE-conjugated MD5-1 mAb to detect the expression of DR5. Flow cytometry analysis was performed to characterize the expression of DR5 on the TC-1 tumor cells. The green profile represents the TC-1 tumor cells. The isotype-matched control antibody was used as the negative control (purple profile).
