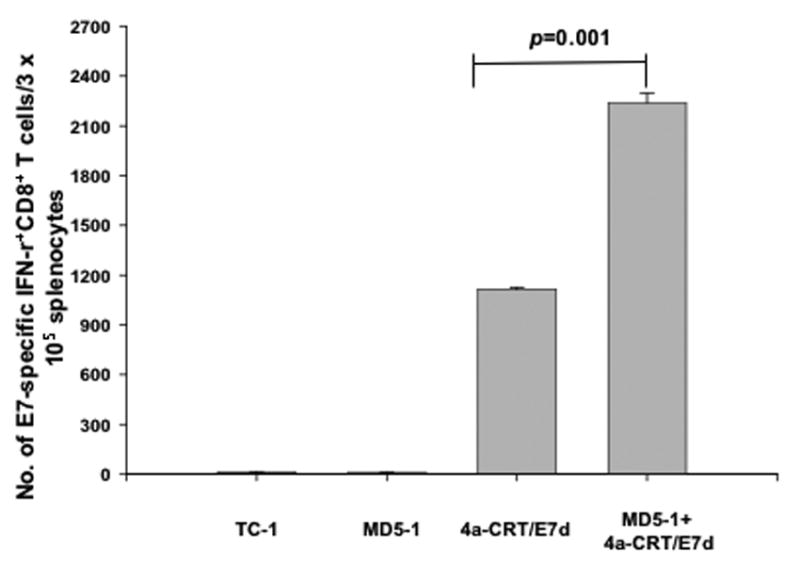
Figure 4. Intracellular cytokine staining followed by flow cytometry analysis to determine the number of E7-specific CD8+ T cells in tumor-bearing mice treated with MD5-1 and/or CRT/E7(detox) DNA.

Groups of C57BL/6 mice (5 per group) were challenged with TC-1 tumor cells and treated with MD5-1 and/or CRT/E7(detox) DNA as illustrated in Figure 2A. One week after the last vaccination, splenocytes from tumor-bearing mice were harvested and characterized for E7-specific CD8+ T cells using intracellular IFN-γ staining followed by flow cytometry analysis. Data is represented as bar graph depicting the numbers of E7-specific IFN-γ-secreting CD8+ T cells per 3×10⁵ pooled splenocytes (mean±s.e.). Data shown are representative of two experiments performed.
