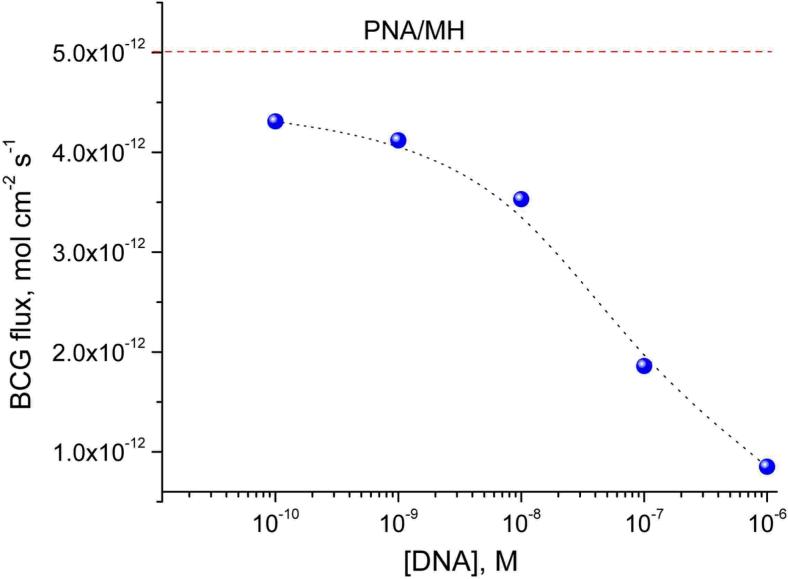
Figure 6.
Calibration curve of complementary ssDNA (5’-G-TCA-CGG-AGT-A20-3’) using PNA/MH-functionalized nanotubules with the external membrane surface blocked with HS-HEG by microcontact printing. The BCG fluxes were measured at a concentration difference of 0.1 mM BCG across the membrane using 0.4 mM TRIS buffer as background. The membranes were incubated for 20 min in the complementary ssDNA followed by thorough washing in hybridization buffer before transport measurements.

