
Figure 4.
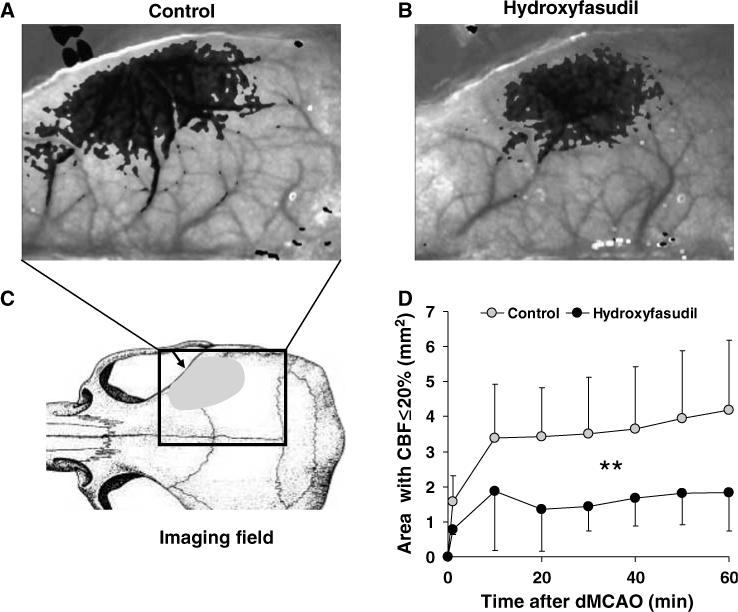
Rho-kinase inhibitor hydroxyfasudil preserved CBF after dMCAO. Representative speckle contrast images taken 60 mins after dMCAO are shown from control (A) and hydroxyfasudil-pretreated mice (B). Superimposed in gray are pixels with residual CBF ≤30%; the more severe the CBF deficit, the darker the superimposed gray. Hydroxyfasudil (10 mg/kg, i.p.) was administered 60 mins before dMCAO. (C) Imaging field (rectangle) included the entire right hemisphere and CBF was measured through intact skull. Arrow indicates the location of dMCAO using a microvascular clip, and shaded area represents the distribution of CBF deficit in this mouse dMCAO model. (D) The time course of changes in cortical area with severe CBF deficit (residual CBF ≤20%) in control (gray circles, n = 15) and hydroxyfasudil-pretreated mice (black circles, n = 5). On dMCAO (time 0), the area of severely ischemic cortex expanded rapidly during the first 10 mins, and continued to enlarge over 60 mins of imaging in controls. In contrast, this area was smaller in hydroxyfasudil group at all time points compared with controls (P < 0.05, two-way ANOVA for repeated measures), and did not expand after 10 mins. The area of CBF deficit was quantified using a thresholding paradigm (see Materials and methods). Vertical bars indicate standard deviations of the mean, and are shown unidirectional for clarity.