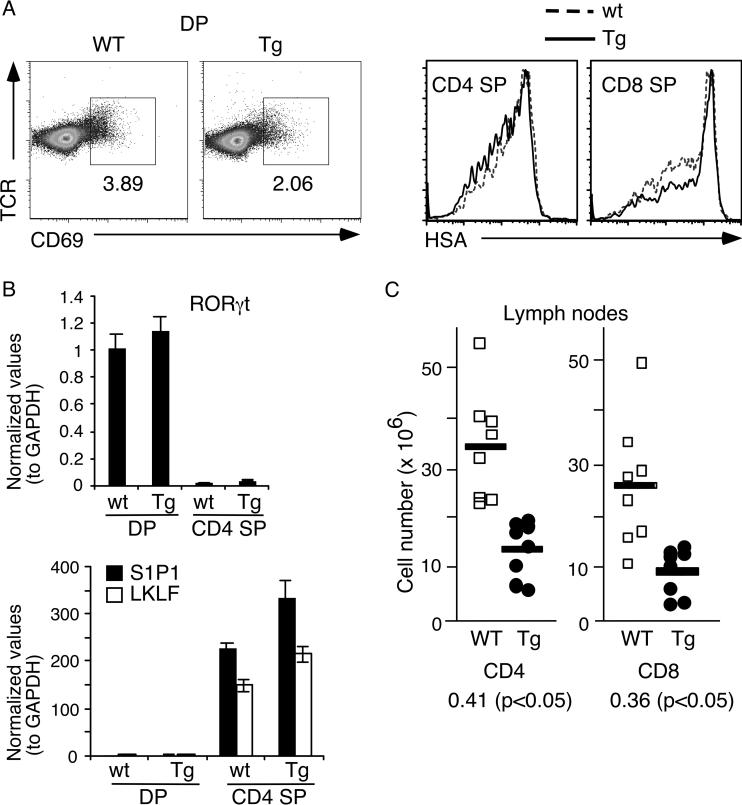
Figure 4.
Normal positive selection and thymic emigration in pTG2-PTEN transgenic mice (A) Left two panels: CD69 versus TCR staining profiles of DP thymocytes in transgenic (Tg) and their littermate controls (WT). Right two panels: HSA staining of CD4 SP and CD8 SP thymocytes in transgenic mice and their littermates. (B) Quantitative real-time PCR of RORγt, S1P1, and LKLF using sorted DP thymocytes and CD4 SP thymocytes. (C) The total cell number of CD4+ and CD8+ lymph node T cell population from transgenic and WT littermate controls (n=8). The ratio of transgenic/non-transgenic cell number for each cell population is indicated below the graph (p values were measured using Student's t-test). The experiments in panel A were done more than 3 times with similar results, those in panel B were based on triplicate samples and data in panel C were based on 8 pairs of mice.

