
Figure 3.
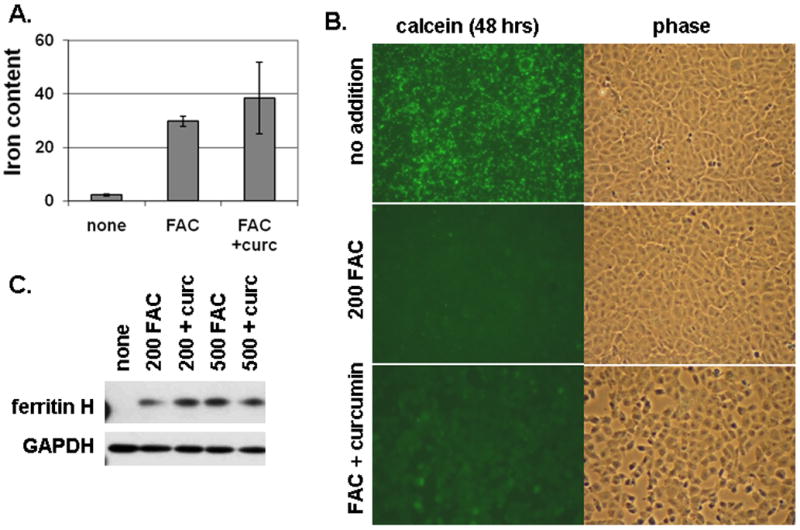
Curcumin does not block iron loading of T51B cells. A. Total iron content. Cells were untreated (none), or treated with 200 μM FAC (FAC), or 200 μM FAC with 50 μM curcumin (FAC + curc). Iron content was assayed colorimetrically as described under Materials and Methods. Mean values (nmol iron/mg cell protein) +/− s.d. of triplicates are reported. B. Quenching of intracellular calcein by iron. Cells were pulsed with calcein-AM and then incubated for 48 hours in media alone (top panels: no addition) or with addition of 200 μM FAC (middle panels: 200 FAC) or 200 μM FAC and 50 μM curcumin (bottom panels: FAC + curcumin). Identical fields viewed by FITC fluorescence (calcein) and phase contrast are shown for each. The cells were viewed without fixation. A decrease in green fluorescence indicates quenching of calcein by internalized iron. C. Ferritin induction by iron. Cells were left untreated (none) or treated with 200 μM FAC (200 FAC), 200 μM FAC and 50 μM curcumin (200 + curc), 500 μM FAC (500 FAC), or 500 μM FAC and 50 μM curcumin (500 + curc) for 5 days. Cell lysates were prepared and processed for western blot using antibodies specific for ferritin H or GAPDH as gel loading control. All results are representative of at least three independent experiments. Additional details are described under Materials and Methods.