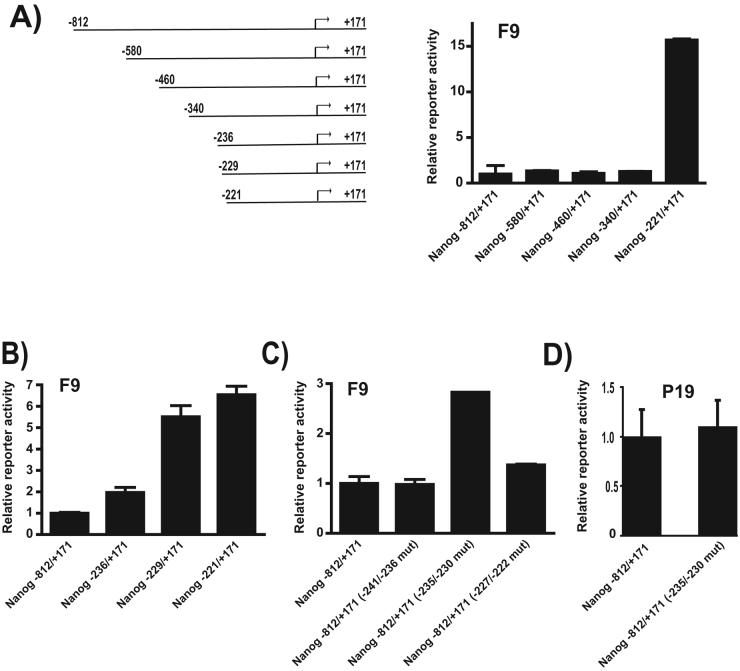
Figure 5. Mapping the Nanog negative regulatory element, NRE-1.
(A) Effect of progressive shortening of the 5′ flanking region of the Nanog gene in F9 EC cells. Promoter schematics indicating coordinates are shown. (B) Effect of additional promoter deletions in F9 EC cells. (C) Effect of site-directed mutagenesis of NRE-1 (−235 to −230) and adjacent regions in F9 EC cells. (D) Effect of site-directed mutagenesis of NRE-1 (−235 to −230) in P19 EC cells. In (A), (B), (C), and (D) the cells were transiently transfected and assayed as described in Materials and Methods. Reporter activity was normalized to that of ß-galactosidase and the activity of Nanog −812/+171 was set to 1. Truncated and mutant promoter/reporter construct activity is shown relative to Nanog −812/+171. The data shown represents the mean and standard deviation of duplicate samples from a representative experiment. Each experiment was repeated twice and similar results were obtained.

