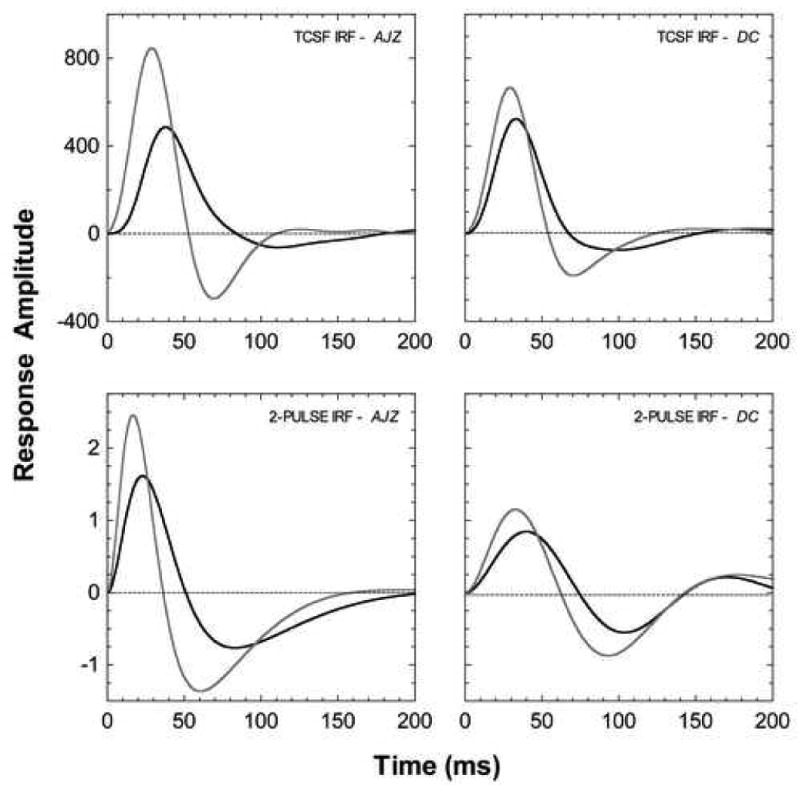
Figure 4.

The effect of dark-adapted rods on the cone pathway temporal impulse response functions. Upper panels: Impulse response functions derived from the temporal contrast sensitivity data in Figure 2. Lower panels: Impulse response functions derived from the 2-pulse data in Figure 3. The grey lines show the IRFs during the cone plateau, the black lines show the IRFs after dark adaptation. The state of rod adaptation alters the amplitude and time time-to-peak of the cone pathway impulse response.
