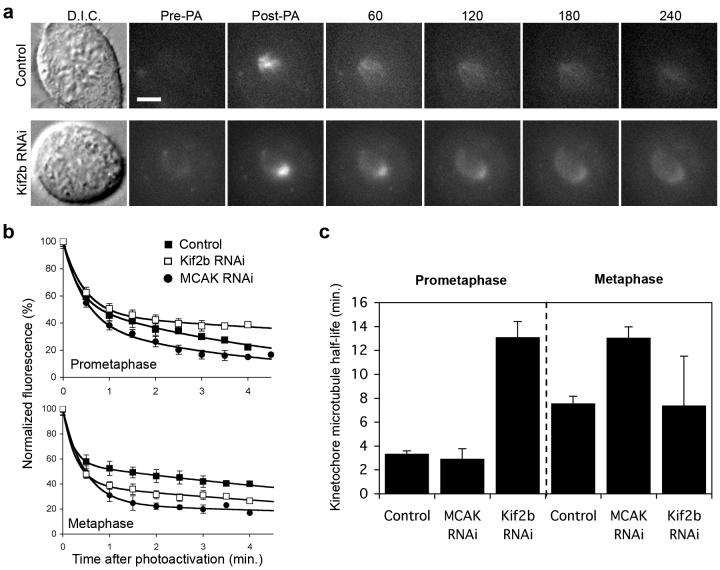
Figure 4. Temporal regulation of kinetochore-microtubule dynamics.
a, Differential interference contrast (D.I.C.) and time-lapse fluorescent images of prometaphase spindles in untreated (Control) and Kif2b-deficient (Kif2b RNAi) U2OS cells before (Pre-PA) and at the indicated times (sec) after activation (Post-PA) of GFP-tubulin fluorescence. Scale bar, 5 μm. b, Normalized fluorescence intensity over time after photoactivation of spindles in untreated (filled squares), MCAK-deficient (filled circles), and Kif2b-deficient (white squares) prometaphase and metaphase cells. Datapoints represent mean ± s.e.m, n = 5 to 11 cells. c, Calculated kMT half-life under different conditions. Error bars represent S.E. from the regression analysis in b.

