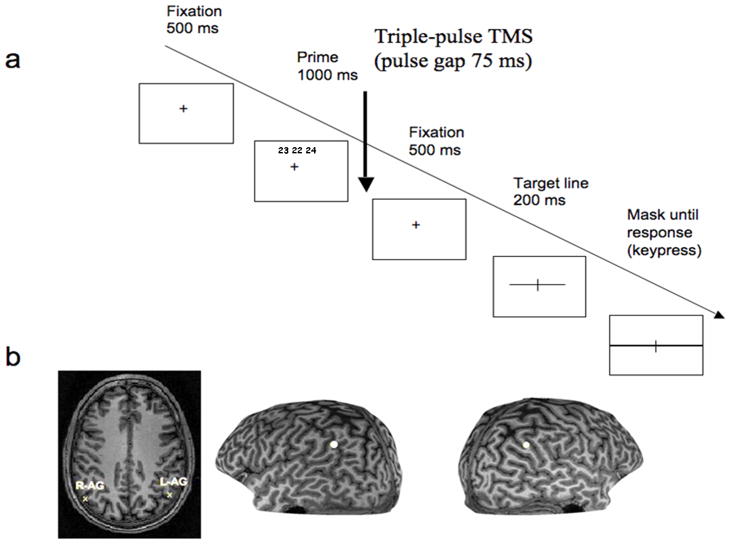
Figure 1.
a) The timeline of an experimental trial. Each trial began with a fixation cross appearing at the center of the screen (500 ms), at which the subjects were asked to fixate throughout the trial. The prime was then presented for 1000 ms (with the fixation cross also present), followed by another 500 ms of fixation. As in previous studies on visual priming (cf. Campana et al., 2002, 2006), TMS pulse was applied in the delay between the prime and the target line. A mask appeared 200 ms after the onset of the target stimulus. This mask, consisting of a thick horizontal line (thicker than the horizontal line of the stimulus) and a vertical line (with the same width as the transection mark) covered the entire area of the previously displayed stimulus and extended to the edges of the projected screen. The mask was displayed until the subject responded. b) Targeted anatomical locations for one representative naive subject. Left: transverse section showing the projected anatomical locations for the right (R-AG) and left (L-AG) angular gyrus respectively. Right: white dots indicating the stimulation sites shown on the left and right hemispheres on the 3-D reconstruction.

