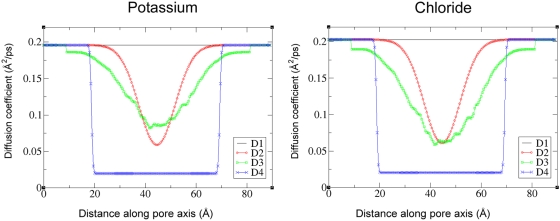
Figure 6. Ion diffusion coefficient profiles.
All the profiles tested (D1–D4) are shown for both ions. Profile D3 is the only one that varies with the pore structure; the figure depicts diffusion coefficient profiles corresponding to the structure at 93.5 ns into the NPT segment of the MD simulations.

