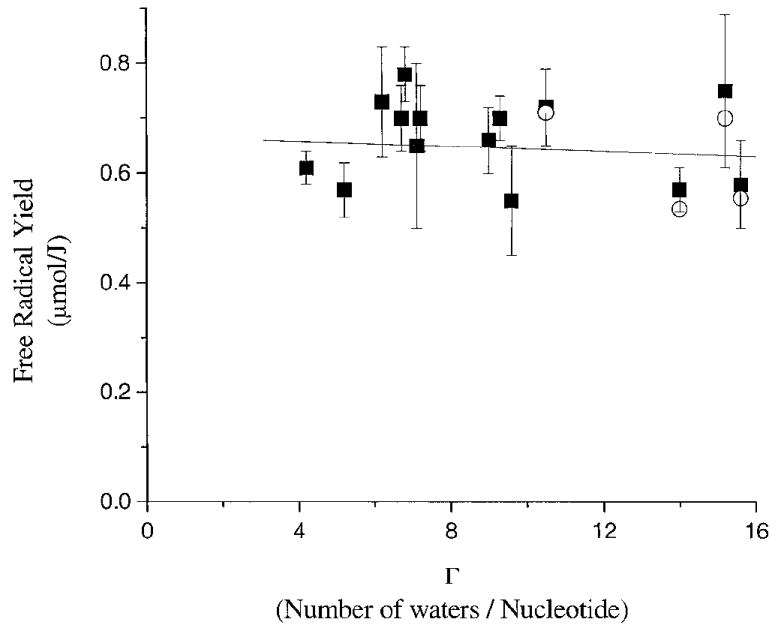
FIG. 5.

Plot of the free radical yields of 14 oligodeoxynucleotide crystals as a function of hydration. The crystal sequences are found in Table 1. The yields G(free radicaltotal) as determined in ref. (10) are shown as solid squares. A linear least-squares has been fitted to G(free radicaltotal). The open circles are the yields G(free radicalDNA) after subtraction of the hydroxyl radical contribution.
