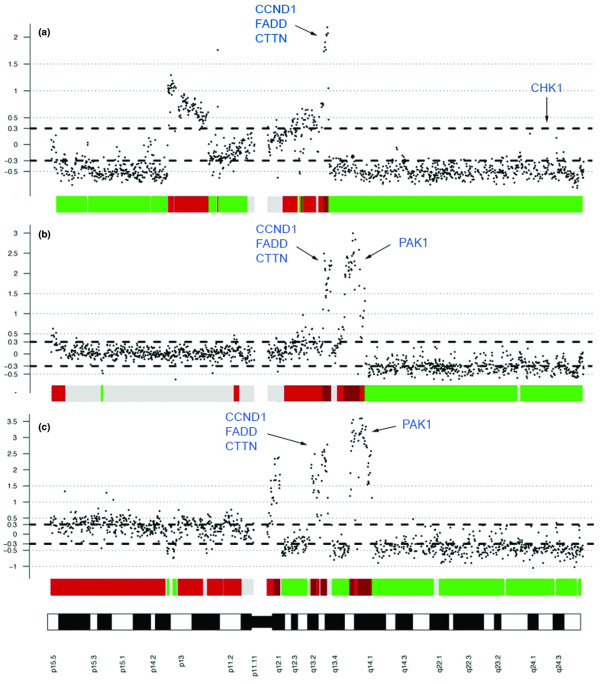
Figure 1.
Genomic profiles of chromosome 11 from three breast tumors demonstrating different amplification patterns. Breast tumor samples were analyzed by array CGH. Bold dashed lines correspond to a log2(ratio) of ± 0.3 and represent gain or loss. The high-level peaks on 11q13 comprising (among others) CCND1, FADD, CTTN (panels a, b, and c) and PAK1 (panels b and c) represent gene amplification. The distal part of chromosome 11q, telomeric to the amplified region, including the CHK1 gene, has been hemizygously deleted, consistently among all three tumors. CGH, comparative genomic hybridization.

