Figure 1.
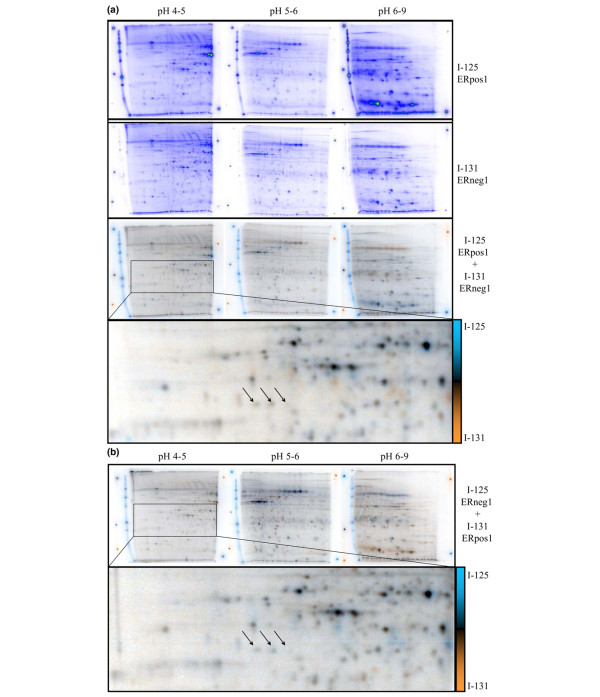
Fifty-four centimeter differential ProteoTope analysis. The panels show actual images from the inverse replicate labeled ProteoTope comparison of all tumors pooled. (a) Inverse ProteoTope comparison of all ER-positive samples pooled into one sample (ER+1 to ER+4 from Table 1) co-electrophoresed with pooled all ER-negative samples (ER-1 to ER-4 from Table 1). Proteins from ER-positive tumors are labeled with I-125, differentially compared with proteins from pooled ER-negative labeled tumors with I-131. The upper panels show the individual signal detected for each isotope, depicted in false spectral color. The signals for each isotope were normalized against each other for total relative intensity in the lower dual channel images, where the signal for I-125 is blue, the signal for I-131 is orange, and equal amounts of both signals produces gray or black signal. Two pure sources each of I-131 and I-125, as well as a 50% mixture of both isotopes, are measured on 2 mm sources pipetted next to each dried gel as imaging controls. The pH ranges of the 18 cm IPGs used for serial IEF are indicated above the panels, and the radioactive iodine isotope signals depicted in each panel are indicated on the right. In this experiment all iodination reactions were performed on 60 μg protein. In the examples shown, the I-125 signal is systematically stronger in all gels (compare lower panels for individual isotopes). Arrows in the enlarged lower panel show three spots identified as PGRMC1. (b) The top panels show the inverse replicate experiment of panel a, where sample ER+1 is labeled with I-131, and sample ER-1 is labeled with I-125. The panel presentation otherwise follows that given above for panel a. Similar gels were produced for all corresponding differential analyses depicted in Table 1. ER, estrogen receptor; IEF, isoelectric focusing; IPG, immobilized pH gradient; PGMRC, progesterone receptor membrane component.

