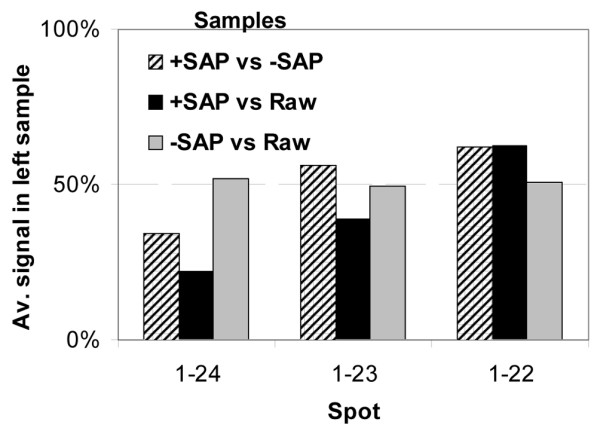
Figure 4.

PGRMC1 isoforms in breast tissue differ in phosphorylation status. Shown are differential inverse replicate ProteoTope quantification of PGRMC1 spots 1–22, 1–23, and 1–24 from Figure 2 and Figure 3 from SAP-treated and control samples. The original sample represents proteins pooled from several primary breast tumors for experimental treatment. The treatment nomenclature is as follows: phosphatase treated sample (+SAP), mock incubation control with phosphatase inhibitors and without addition of SAP (-SAP), and original sample frozen before incubation (Raw). Spot numbers are indicated. Quantification of the differential ratio of signal intensities from two samples per two-dimensional PAGE gel for each of the spots from the indicated inverse replicate gel pairs +SAP versus -SAP, +SAP versus Raw, and -SAP versus Raw. The ratio of signal for control and treated samples increases in a phosphatase-dependent manner, consistent with at least some fraction of spots 1–24 and 1–23 in the original sample representing phosphorylated isoforms of PGRMC1 present in spot 1–22. PGMRC, progesterone receptor membrane component; SAP, shrimp alkaline phosphatase.
