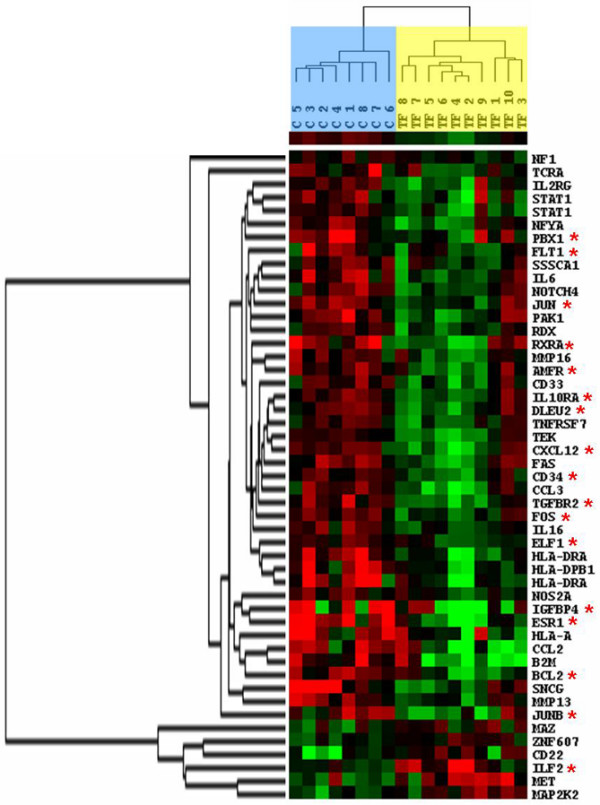
Figure 1.

Dendogram of 18 tumor samples (eight control and 10 TF). Using the Cluster and Treeview software packages, the samples were ordered according to their degree of similarity after hierarchical clustering of the expression profiles of the 49 selected genes. Each column represents a tumor sample and each row a single gene. Expression levels above the median are presented in red and expression levels below the median are presented in green. The control tumor samples are colored blue, and the TF tumor samples yellow. Red asterisks represented genes whose expression is regulated by estradiol treatment in breast cancer cell lines [15,24-31]. C, control; TF, tamoxifen failure.
