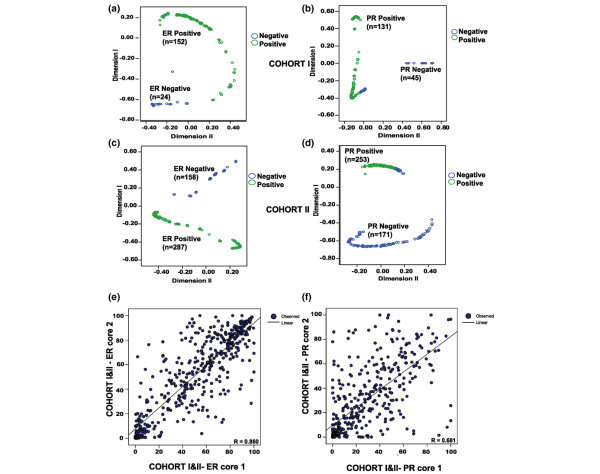
Figure 2.
Threshold identification and validation for oestrogen receptor and progesterone receptor data, and marker heterogeneity assessment. Random forest clustering (RFC) clusters generated using automated quantitative oestrogen receptor (ER) and progesterone receptor (PR) data in Cohort I (test set): negative cluster and positive cluster for (a) the ER and (b) the PR. (c) ER RFC and (d) PR RFC in Cohort II (validation cohort). (e) Scatter plot demonstrating strong correlation between duplicate ER cores, indicating a homogenous pattern of expression. (f) Scatter plot showing weaker correlation between duplicate PR cores, indicating a more heterogeneous pattern of expression.

