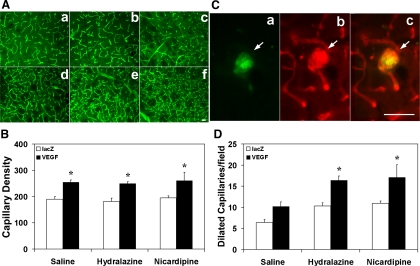
Fig. 3.
VEGF induces angiogenesis in the brain. A: photomicrographs show capillaries in the 6 groups of mice with different treatments. Scale bar = 50 μm. B: bar graph quantifies the number of capillaries in the 6 groups. Data are means ± SD; n = 6/group. *P < 0.05 vs. AAVlacZ-transduced group. C: photomicrographs show CD31 and BrdU double staining of dysplastic capillaries. Red is CD31-positive endothelial cells, green is BrdU-positive staining, and merged yellow color indicates that the endothelial cell is in the proliferating stage. Scale bar = 50 μm. D: bar graph shows the number of dilated capillary counts in the same groups above. Data are means ± SD; n = 6/group. *P < 0.05, AAVVEGF-transduced mice treated with hydralazine or nicardipine vs. AAVVEGF-transduced mice treated with saline.

