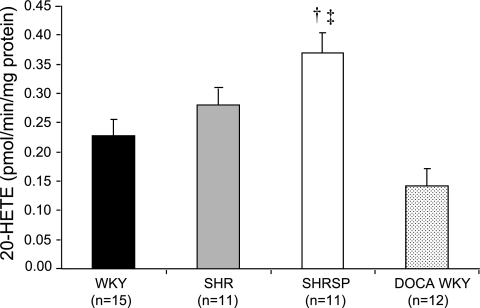
Fig. 3.
Comparison of the production of 20-HETE in the cerebral vasculature of normotensive and DOCA hypertensive Wistar-Kyoto (WKY) rats, spontaneously hypertensive rat (SHR), and spontaneously hypertensive stroke-prone rats (SHRSP). Mean values ± SE are presented; n, number of animals studied per group. †Significant difference from the corresponding value in WKY rats; ‡significant difference from DOCA hypertensive WKY rats.

