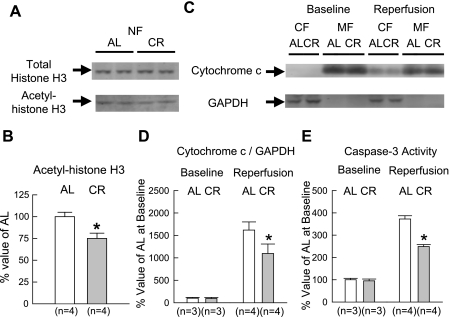
Fig. 4.
Western immunoblot analyses for histone H3 and cytochrome c as well as caspase-3 activity. A: representative Western immunoblots showing the expression of total and acetyl-histone H3 (Lys9 and Lys14) in the NF. B: densitometric analysis of acetyl-histone H3 (Lys9 and Lys14). C: representative Western immunoblots showing the expression of cytochrome c and GAPDH in each fraction. D: densitometric analysis of cytochrome c/GAPDH in the CF. E: caspase-3 activity in the CF. MF, mitochondrial fraction. Data are expressed as means ± SE. *P < 0.05 vs. the corresponding AL group.

