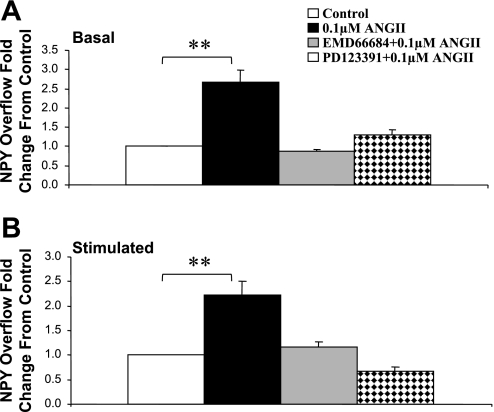
Fig. 4.
Effects of ANG II (0.1 μM), ANG II (0.1 μM) + EMD-66684 (0.1 μM), and ANG II (0.1 μM) + PD-123391 (0.1 μM) on basal (A) and NS-induced (B) NPY overflow from mesenteric beds of 10- to 12-wk-old SHRs. Data are plotted as fold changes from control (pre-ANG II values). Each bar is the mean ± SE of 5–7 preparations. **P < 0.01 compared with control.

