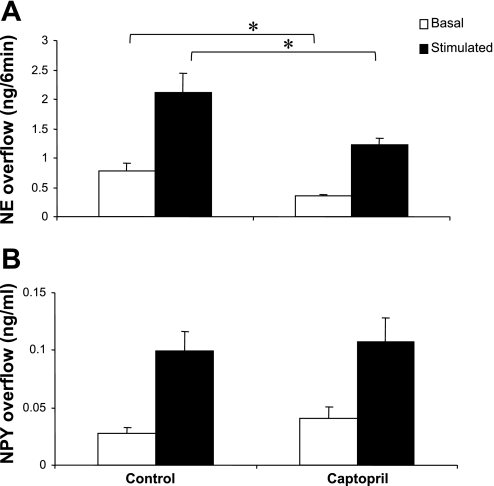
Fig. 6.
Basal and nerve-stimulated overflow of NE (A) and NPY (B) in the absence (control) and presence of captopril (0.1 μM). Data are plotted as NE overflow (in ng/min) or NPY overflow (in ng/ml). Each bar is the mean ± SE of 5 preparations obtained from 10- to 12-wk-old SHRs. *P < 0.05 compared with control.

