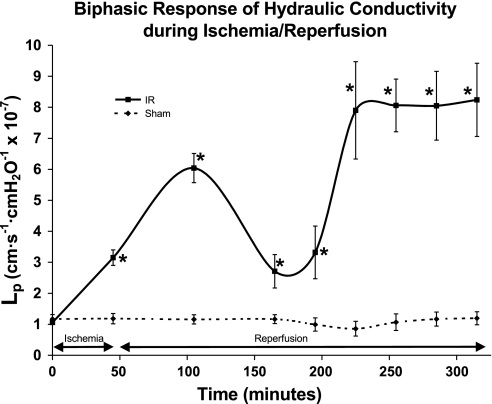
Fig. 1.
The biphasic increase in hydraulic conductivity in response to 45 min of ischemia and subsequent reperfusion shows a first peak of increased hydraulic conductivity (Lp) at 1 h of reperfusion and a second peak in at 3 h of reperfusion. Sham animals showed no change in Lp throughout the time period of the study protocol. The units for Lp are cm·s−1·cmH2O−1 × 10⁻⁷. *Significant difference from baseline values (P < 0.01).

