Fig. 1.
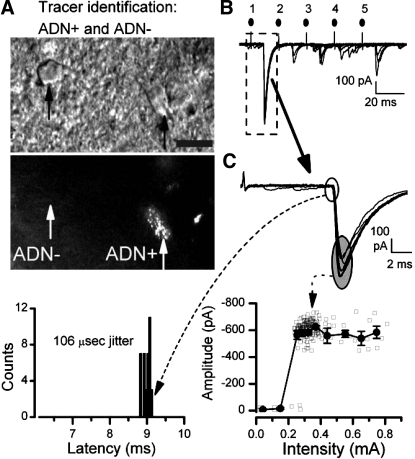
The presence of fluorescent, anterogradely transported dye from the aortic depressor nerve (ADN) allowed anatomical identification of solitary tract nucleus (NTS) neurons directly receiving aortic baroreceptor terminals (ADN+) in vitro. A–C are from a single representative ADN+ neuron. A: under infrared differential interference contrast (IR DIC) microscopy, numerous cell bodies were apparent (top micrograph, black arrows) in thin brain stem slices used for recordings. Using fluorescence excitation, bright puncta of DiI label were revealed along the surface of some cell bodies and their proximal dendrites (bottom micrograph, right, white arrow, ADN+), and these were considered anatomically identified second-order baroreceptive NTS neurons. Note that adjacent dye-negative neurons (white arrow, left, ADN−) had similar appearance under IR DIC but lacked DiI puncta. Scale bar is 10 μm. B: shocks delivered to the solitary tract (ST) evoked large low-jitter excitatory postsynaptic currents (EPSCs) in this ADN+ neuron (original traces recorded from right ADN+ neuron depicted in A). Amplitudes depressed with shocks (1–5, solid circles above traces) were repeated at a 20-ms interval in a burst of 5 stimuli repeated each 3 s (7 trials displayed). C: expanded analysis of EPSC1 (dashed line box in B) examined the timing of the onset of the EPSC, latency (dashed line and arrow to bottom left), and the amplitude (dashed line and arrow to bottom plot). Examination of the timing of EPSC1 (open oval) showed that the latency of this ADN+ neuron varied minimally (bottom plot, left) with ∼9 ms and a jitter (SD of latency) of 106 μs (n = 38 trials), well below the 200-μs cutoff for monosynaptic pathways directly from ST. The amplitudes of EPSC1 (shaded oval) characteristically varied from shock to shock, but increasing shock intensity indicated a sharp threshold profile for evoking the EPSC and no change in amplitude at suprathreshold intensities (bottom plot, right). Shaded squares are individual values, and solid squares are means ± SE. Original synaptic response traces displayed in B and C were recorded using tests at twice the threshold intensity, but note that many trials are not displayed to increase clarity. Similar results were found in all ADN+ neurons. ADN− neurons were tested using identical protocols and analyses.

