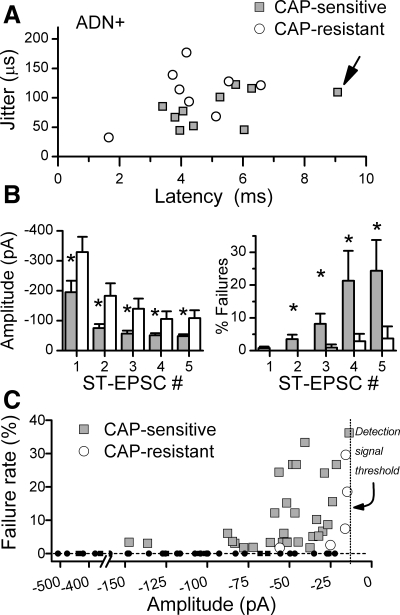
Fig. 4.
A: across all ADN+ neurons tested with CAP (n = 18), latency-jitter values for ST-EPSCs had considerable overlap between CAP sensitive (shaded squares, n = 10) and CAP resistant (open circles, n = 8). The CAP-sensitive point marked by the arrow corresponds to the representative ADN+ neuron presented in detail in Fig. 1. B: the mean ST-EPSC amplitudes of CAP sensitive (left, shaded bars), however, were significantly smaller (*P < 0.02) than for CAP resistant (open bars) to the first as well as subsequent ST shocks (ST-EPSC #) during the burst of 5 stimuli. Failures of CAP-resistant ST-EPSCs (right, open bars) were quite low at all ST shock positions and remained <5% throughout. Failures for CAP-sensitive neurons were similar to CAP-resistant neurons at ST-EPSC1 (right, shaded bars), but increased substantially for later responses within the burst (*P < 0.001). C: a plot of the individual mean failure rates against the mean amplitude for successful, nonfailure events shows that failures occurred at event amplitudes well above the detection threshold of 5–15 pA. Failure rates were calculated from a minimum of 30 trials for EPSC1–EPSC5 for each neuron. Small solid points indicate zero failure points (dashed horizontal line), whereas larger points indicate mean event amplitudes at corresponding mean failure rates. The mean reliable level of detection of single events is represented by dotted vertical line, although this was adjusted in each neuron (range 5–20 pA). Note that no failures occurred in CAP-resistant EPSCs (open circles) until amplitudes were quite depressed (corresponding to EPSC3–EPSC5), whereas recurring failures were found in CAP-sensitive EPSCs (shaded squares) at amplitudes as high as 145 pA.

