Fig. 2.
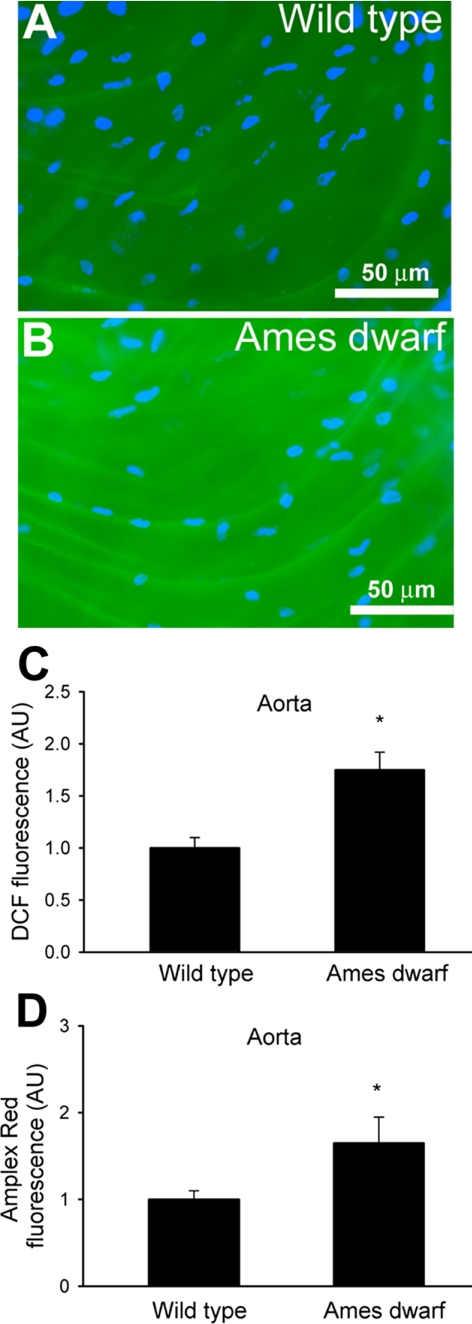
A and B: representative fluorescent images showing H2O2 production (measured by the C-H2DCFDA fluorescence method) in endothelial cells of en face preparations of aortas of wild-type (A) and Ames dwarf (B) mice. Green fluorescence, dichlorofluorescein (DCF); blue fluorescence, Hoechst-stained endothelial nuclei (original magnification ×10). C: time course of buildup of DCF fluorescence in aortic segments of the mice was obtained. Bar graphs are summary data for slope factors normalized to cell number (i.e., nuclear DNA content, assessed by Hoechst fluorescence intensity), representing tissue H2O2 production. Bar graphs are summary data of DCF fluorescent intensities in endothelial cells of Ames dwarf mice and wild-type control mice (means ± SE, n = 5 animals for each group; *P < 0.05). AU, ΔDCF fluorescence/dt/DNA content. D: results from Amplex red-horseradish peroxidase assays. Time course of buildup of Amplex red fluorescence by aortic segments of Ames dwarf mice showed a significantly steeper slope than those of wild-type controls. Data are means ± SE. n = 5 animals for each group. *P < 0.05.

