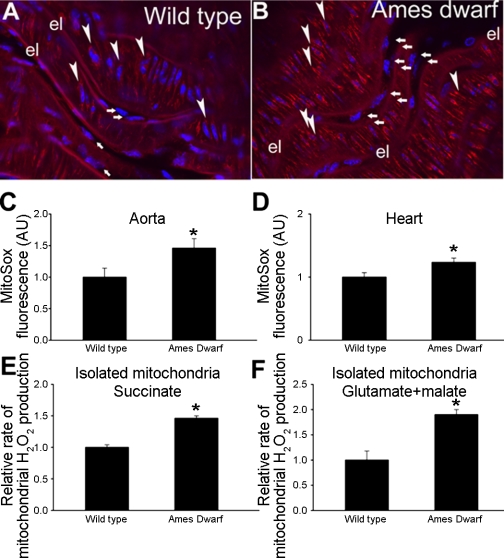
Fig. 4.
A and B: representative confocal images showing stronger perinuclear MitoSox staining (red fluorescence) in Ames dwarf mouse aorta (arrows, endothelial cells; arrowheads, smooth muscle cells; el, internal elastic lamina) compared with wild-type control vessel. Hoechst 33258 (blue fluorescence) was used for nuclear staining (original magnification ×20). C and D: time course of buildup of MitoSox fluorescence in Ames dwarf mouse and wild-type control aortas (C) and cardiac muscles (D) was obtained. Bar graphs are summary data for the slope factor obtained from the time course experiments normalized to tissue mass, representing mitochondrial ROS production in the tissues. Data are means ± SE (n = 5 in each group). *P < 0.05. E and F: relative H2O2 production by heart mitochondria respiring on succinate (E) or glutamate + malate (F) as substrate. For details see methods. Hydrogen peroxide generation rates were determined fluorometrically. Data are means ± SE. *P < 0.05.

