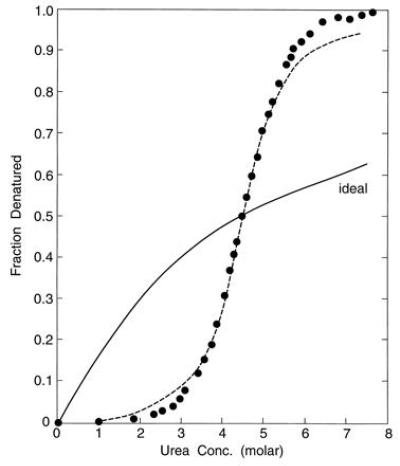
Figure 1.

Unfolding curve for HPr, bacterial histidine-containing protein, in aqueous urea solutions. Experimental data from ref. 6. The broken line through the points presents the curve calculated from Eq. 27. The “ideal” curve is that for a transformation in which successive steps of ligand binding are energetically intrinsically identical.
