
FIGURE 3.
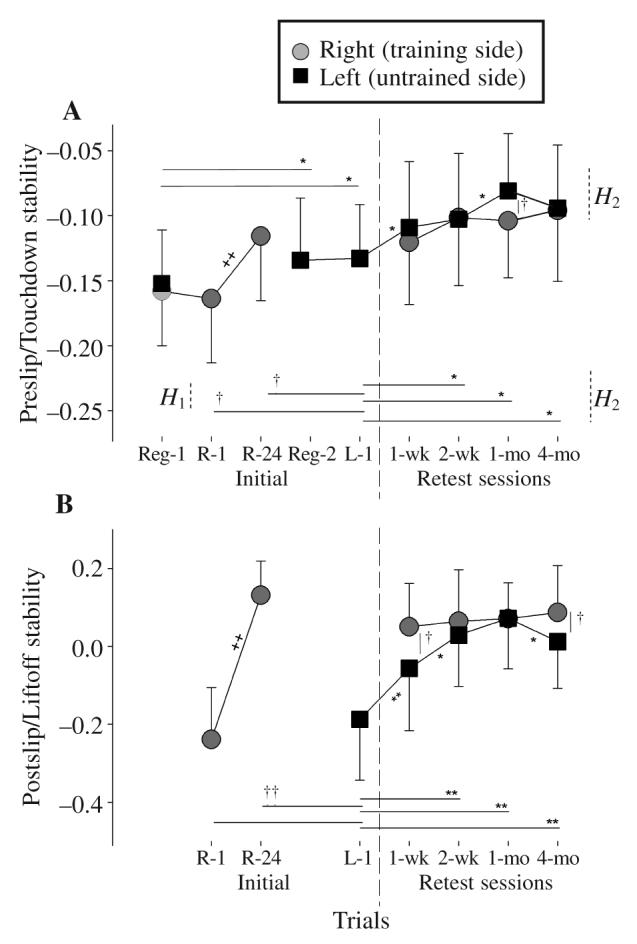
Group means (± 1 SD) of (A) pre- and (B) postslip stability for the first and last training (right) side slips (R-1 and R-24, respectively) and the slip on the untrained (left) side (L-1) from the initial session (Hypothesis 1–H1). Also shown are the slip trials from the right and left sides for the 4 retest sessions conducted about 1 week, 2 weeks, 1 month, and 4 months after the initial training session (Hypothesis 2–H2). The preslip stability is also demonstrated for the right and left limbs (at touchdown) during a regular (Reg-1) walking trial prior to the first right slip and prior to the first left slip (Reg-2). * and † indicate p < .05 for left and interlimb comparisons, respectively; ++, ** and †† indicate for right, left, and interlimb comparisons, p < .001. Less negative values of stability indicate higher stability. A solid line connecting 2 data points without symbols indicates p > .05.