
Fig. 4.
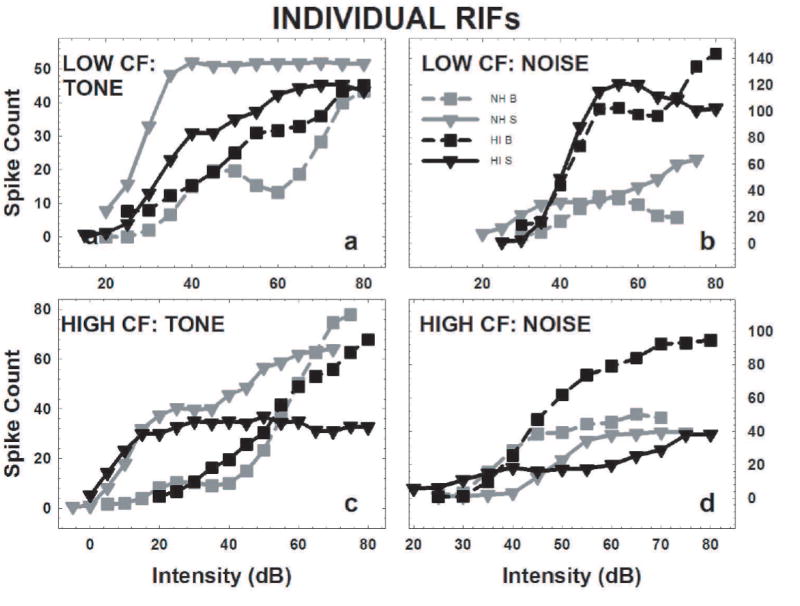
The RIFs of 8 NH units and 8 HI units illustrate how units in each CF/FRA category responded to CF tones and noise bursts that varied in intensity. Each of these RIFs was smoothed using a 3 intensity moving average in the same manner as the rest of the RIFs in the sample. The RIFs for the units with sharp (S) FRAs were displayed using inverted triangles, with the solid lines representing the fitted functions. Broad (B) FRAs are indicated by squares and dashed lines. RIFs obtained from NH IC are in gray, and RIFs obtained from HI IC are in black. The spike count tick labels were included on the right for ease of reading. a) The low/broad units’ tone-RIFs are shifted to the right of the low/sharp units’ tone-RIFs for both the NH and HI units. b) The NH low/broad units’ noise-RIF has the lowest response of any noise-RIF in this category. c) These high-CF tone-RIFs resemble those of the low CF units. d) The HI high/broad unit had the strongest noise response of the high-CF units shown here, and the noise-RIF of the NH high/sharp unit lay farthest to the right.