
Fig. 5.
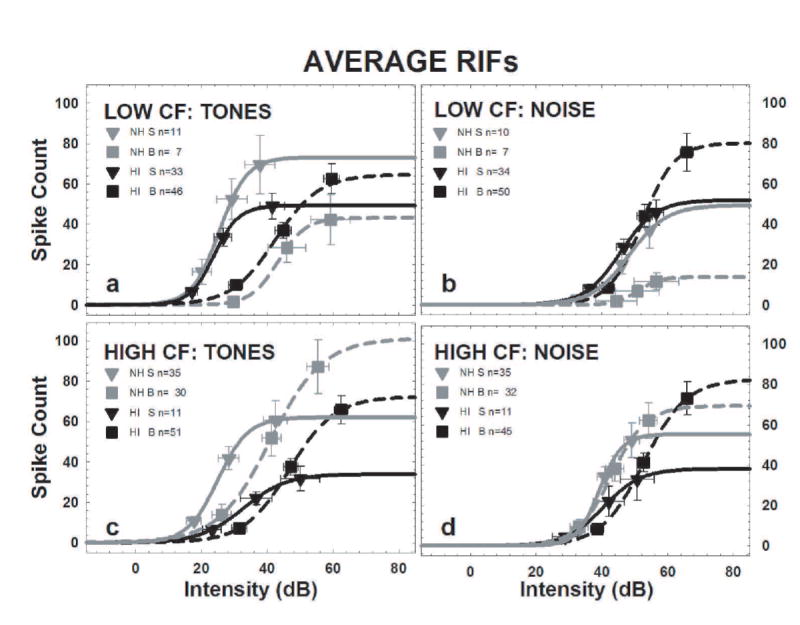
These average RIFs represent the central tendency of all the units in each CF/FRA category for the NH and the HI data. Each average RIF was constructed by plotting the count and intensity value at which the mean data, averaged for all units within the category, reached the 10%, 50%, and 90% points, and fitting those data points with a sigmoid function. Averages were calculated separately for NH and HI data, broad and sharp RIFs, and for CF tone and noise RIFs. The spike count tick labels were included on the right for ease of reading. The means for the units with sharp FRAs (S) were displayed using inverted triangles, with the solid lines representing the fitted functions. Broad FRAs (B) are indicated by squares and dashed lines. RIFs obtained from NH IC are in gray, and RIFs obtained from HI IC are in black. The minimum and maximum counts are themselves averages as described in the methods. a) The tone RIFs of the low/broad units RIFs were shifted to the right of the tone RIFs of the low/sharp units. There were no differences between the NH and HI mice and no systematic differences in the spike counts. b) The noise RIFs of NH low/broad units have striking low 50% and maximum spike counts. c) The tone RIFs of the high-CF units resemble those of the low-CF units. d) The noise RIFs of the HI high/broad units shifted to right of the HI high/sharp RIFs but the NH high/sharp RIFs were not shifted relative to the NH high/broad RIFs. The HI high/sharp RIFs had lower 50% and maximum counts than the other high CF noise RIFs. Note that, because of the hearing loss, there are more low frequency CFs in the HI mice.