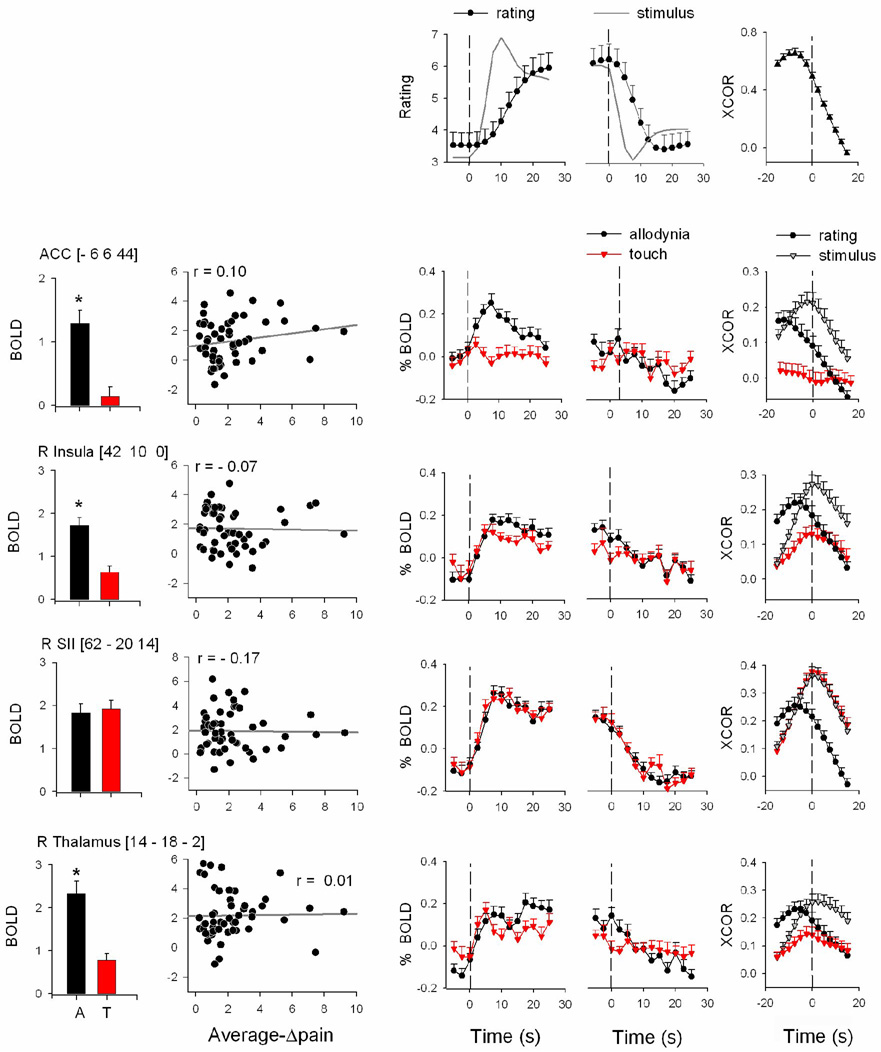
Figure 6. Response properties for four additional brain regions.
Bar graphs indicate differential responses to DMA and touch tasks (A, T; black and red). Scatter-grams show the relationship between DMA ratings and activity. Time course of BOLD responses is also shown relative to start and end of stimuli (third and fourth panels from left). Cross-correlations (XCOR) among BOLD and stimuli and ratings are shown in right-most panels. Top row is the same as figure 5A.

