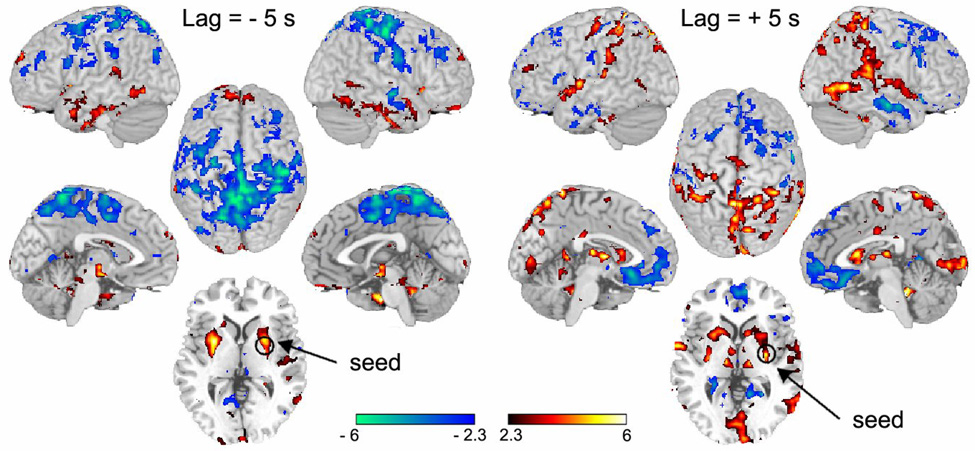
Figure 7. Evolution of brain connectivity in time for the signal best related to perception of DMA.
The time course of the left putamen was used as the seed, delayed by either −5 s (left) or by + 5 s (right), and correlated to all brain voxels. Resultant maps show the brain network of regions correlated (red) and anti-correlated (blue) to the seed signal. In the left panel, large parts of the parietal cortex are anti-correlated, while brainstem, cerebellar, and inferior temporal areas are positively correlated with the delayed seed signal. In the right panel, thalamus and large parts of parietal cortex are correlated, while medial prefrontal cortex is anti-correlated with the delayed signal. For each map, left two images are lateral and medial views of right hemisphere; center top image is a dorsal view and bottom is a mid-horizontal slice at the level of the seed; right two images are lateral and medial views of left hemisphere.

