Fig. 1.
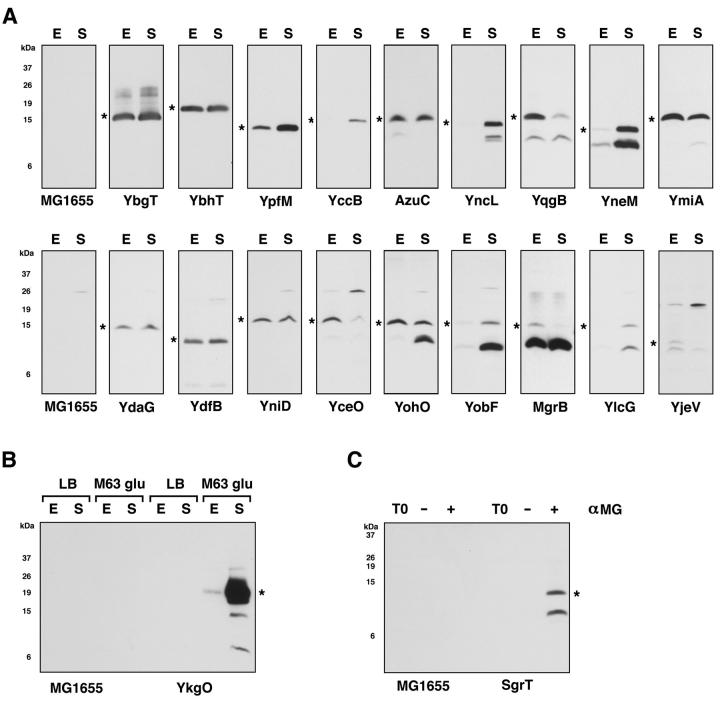
Immunoblot analysis of previously-annotated short ORFs tagged with SPA. Immunoblot analysis using anti-FLAG, alkaline phosphatase-conjugated antibodies was carried out with whole cell extracts harvested from MG1655 cultures.
A. Cells were grown to (E) exponential and (S) stationary phase in LB medium. Immunoblots shown on the top row are of highly expressed small proteins, whereas immunoblots on the bottom row are of proteins with lower expression. MG1655 control lanes were run for each blot and representative lanes are shown. For those proteins with lower expression (bottom row) an additional cross-reacting band of approximate 26 kDa can also be observed for MG1655 grown to stationary phase.
B. Cells were grown to (E) exponential and (S) stationary phase in LB and M63 medium containing 0.2% glucose.
C. Cells were grown to (T0) exponential phase in LB medium and then treated with (−) water or (+) 1% α-methylglucoside. In all cases, a fraction equivalent to the cells in OD600 = 0.057 was loaded in each lane. The star (*) indicates the band corresponding the fusion protein. The positions of the markers for one blot are shown. This only provides the approximate sizes of the proteins because there was slight variation in the running of gels. Exposure times were optimized for each panel for visualization here, therefore the signal intensity shown does not indicate relative abundance between proteins. Given the need for longer exposure times, some background bands were detected for the immunoblots in the second row of (A).

