
Fig. 6.
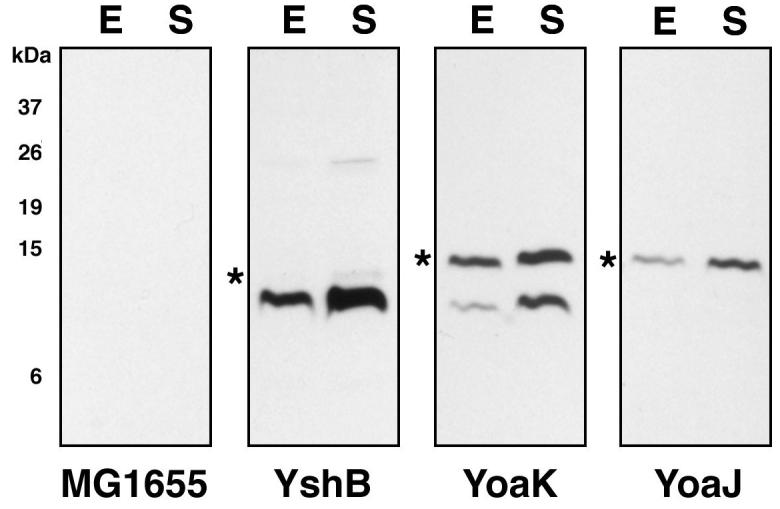
Immunoblot analysis of small proteins predicted on the basis of the presence of a RBS and protein homology.
Whole cell extracts of MG1655 cells grown to (E) exponential and (S) stationary phase in LB medium were analyzed as in Fig. 1. Again the star (*) indicates the band corresponding the fusion protein. The caveats of the marker lane and exposure times are as for Fig. 1.