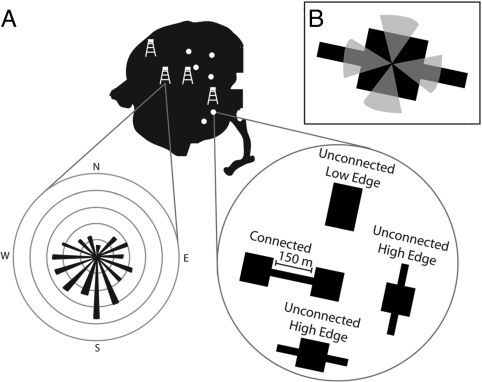
Fig. 2.
Locations of study sites and wind measurements. (A) Location of six experimental landscapes (dots) and four wind towers (tower icons) at the Savannah River Site near Aiken, SC. The wind rose demonstrates the type of data used in analyses and represents the frequency of wind observations within directional bins from one tower in 2006–2007. (B) Shown are 45° bins perpendicular to the landscape orientation of each patch where wind observations were summed (i.e., wind incidence; see SI Text).

