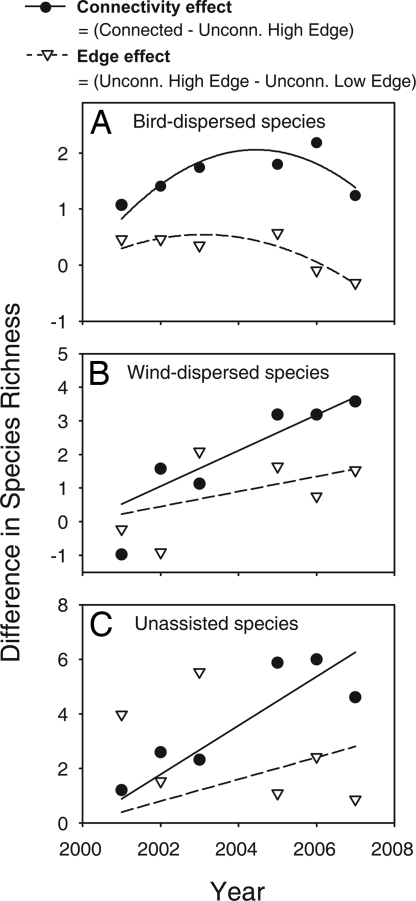
Fig. 4.
The difference in species richness between patch types showing the relative importance of connectivity and edginess over time for bird-dispersed (A), wind-dispersed (B), and unassisted (C) species. Significant relationships are depicted by lines indicating the best fit via least-squares regression. Solid lines and circles indicate the difference in connected and unconnected high-edge patches and represent the importance of connectivity for species richness dynamics. Dashed lines and triangles indicate the difference between unconnected high- and low-edge patches and represent the importance of patch edge effects for species richness dynamics.

