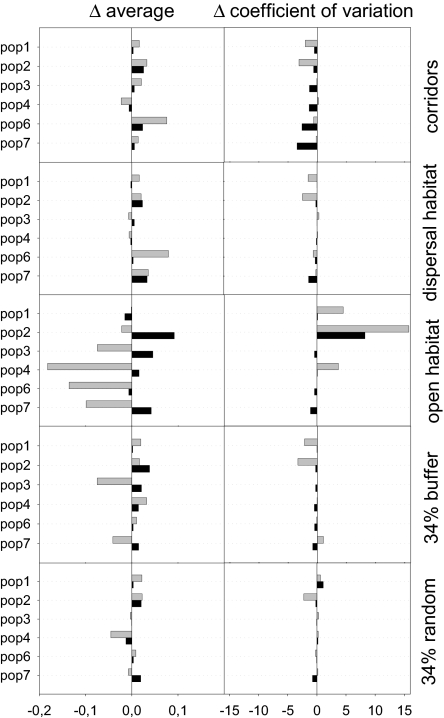
Fig. 4.
Variations in the yearly per capita emigration (E, black bars) and immigration (I, gray bars) rates for each local population (pop1 to pop7) in different matrix configurations. The bars represent the difference Δ between the average value (and coefficient of variation) of E and I for the current landscape (see Fig. S1) and the values estimated for each configuration. The configurations are Corridors: a linear corridor (4 cells of dispersal habitat wide) connecting each subpopulation to its closest neighbor; Dispersal habitat: all of the matrix (except for barriers) covered by dispersal habitat; Open habitat: all of the matrix (except for barriers) covered by open habitat; 34% buffer: 34% of the matrix composed by dispersal habitat located buffering breeding habitat (see Fig. 3); 34% random: 34% of the matrix composed by dispersal habitat located randomly (see Fig. 3).

