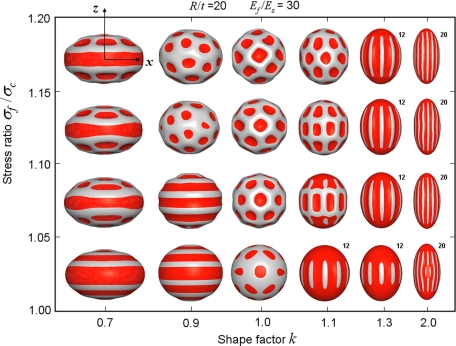
Fig. 1.
Deformation map of spheroid as both parameter k and film stress are varied (with R/t = 20 and Ēf/Ēs = 30). In all buckled morphologies in Figs. 1–3 and Figs. S1 and S2, the dark (red) areas mean that within such concave regions, the magnitude of the radial displacement is smaller than a certain value; all snapshots of the morphology are rescaled to fit into the map. For ridged morphology, the number of buckles is shown on the top corner of each simulated pattern.

